

BMP testingBy-products of the agri-food industrysingle study (2 samples)
Green coffee processing residues — BMP: 2 studies, weighted mean 138 m³ CH₄/t VS
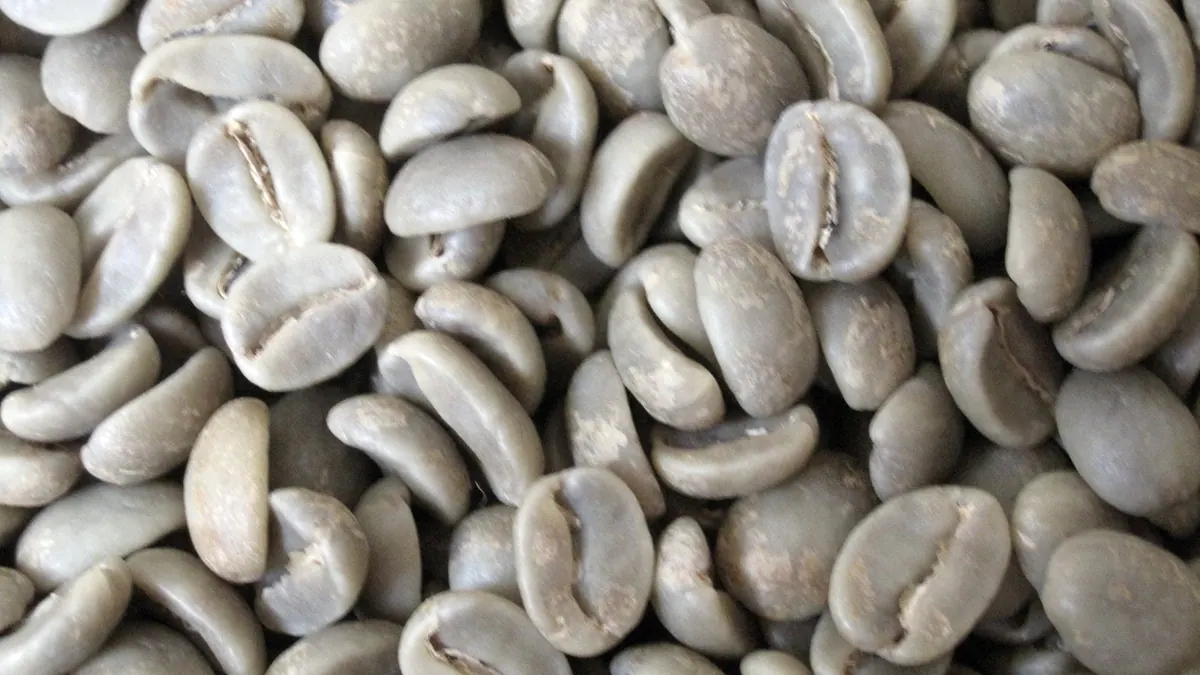
Dust and silverskin from green coffee processing are dry, light wastes from roasteries and bean sorting plants, with a high fibre content and a low acidification potential.
rating: neutralCH₄ ≈ 52 % (estimate)
Photo Michael Allen Smith@INeedCoffee from Seattle, USA / Wikimedia Commons, licence CC BY-SA 2.0, source file; changes: cropping

- Weighted mean
- 138m³ CH₄/t VS
- Range
- 128–148m³ CH₄/t VS
- Records
- 2single study (2 samples)
- Publications
- 1source
- Temperatures
- 37 °Cof the test
Methane in biogas
Medium methane content · ≈ 5.2 kWh/m³ of biogas
estimate from the substrate type The collected studies contain no measurement. The interval follows from the approximate composition (carbohydrate-dominated (no protein or fat characteristics)) and the yields of compound groups according to FNR.
Rating for biogas plants
neutral — editorial rating for biogas plantsNo clear advantages — worth charging a fee for accepting it
Potential per tonne of fresh matter: moderate, but limited by the poor degradability of the organic matter (103 m³ CH₄/t); process risk: inhibitors. Handling costs: fibres, floating layer, slow degradation.
Why? Rating factors
Potential per tonne +1
- +1potential 103 m³ CH₄/t fresh matter (BMP 138 × DM 81.9 % × VS 91.5 %); low degradability of VS (BMP 138 m³ CH₄/t VS) — points capped
Process stability −1
- −1inhibitors: natural or residues (e.g. limonene, polyphenols, antibiotics, metals)
Handling and costs −1
- −0.5fibres, floating layer — shredding and intensive mixing
- −0.5slow degradation — long retention time
Total points: −1 · thresholds: ≥ 2.5 very good, ≥ 1 good, below — neutral; negative with cumulative process risk.
Add to the co-digestion calculator CSV data
BMP curves from 2 studies
Weighted mean Individual records
Dashed lines are a model curve (first-order kinetics, B(t) = B₀·(1 − e−kt)); the end point comes from the publication. All curves are model curves.
Cumulative methane production over the test [m³ CH₄/t VS]. The thick line is the weighted mean of all records (138); dots mark the end values given in the publications. Point at the chart to read values; click a legend item to hide or show a record.
Records and sources
Download CSV| Source | BMP m³ CH₄/t VS | Temperature | Sample | Curve |
|---|---|---|---|---|
| Velasquez-Pinas et al. (2023) · 1 DOI | 128 | 37 °C · mesophilic | green coffee film | end point (model curve) |
| Velasquez-Pinas et al. (2023) · 2 DOI | 148 | 37 °C · mesophilic | green coffee powder | end point (model curve) |
| Weighted mean | 138 | arithmetic mean 138, SD 14 | ||
Typical composition
- Dry matter (DM)
- 81.9% (range 69.7–94.1)
- Volatile solids (VS)
- 91.5 % DM (range 90.9–92.1)
Median and range of the determinations reported in the publications behind this substrate's BMP records (read from: MY-D); dry matter: 2 determinations, volatile solids: 2 determinations.
Sources: Velasquez-Pinas et al. (2023).
The composition of the raw material varies between batches — for plant calculations use an analysis of your own sample. The calculator inserts typical values automatically.
Process properties
Low confidence: the description is based on general characteristics of the substrate group, not on studies of this material. Treat it as a hint to be verified.
Advantages
- Methane potential in the Substraty.pl BMP dataset: weighted mean 138.0 m³ CH₄/t VS (SD 14.1; 2 records, 1 source).
- A dry lignocellulosic waste that is easy to store (Hendriks and Zeeman 2009).
Drawbacks and risks
- Polyphenols and caffeine may inhibit at high doses (Chen et al. 2008).
- Dust - exclude dust generation during dosing.
Co-digestion — what to combine it with, what to watch out for
- combines well
substrates: high alkalinity (buffer) — e.g. Cattle manure, Pig slurry, Cattle slurry, Duck slurry, Rumen and digestive tract content
Slurry supplies N and alkalinity, balancing the high C/N of the material.[1][2]
Dosing
No source threshold.
Introduce gradually, starting with a small dose and monitoring the process (e.g. FOS/TAC, pH, gas composition).
Practical requirements
- Shred: shredding increases the surface available for degradation and speeds it up, but does not necessarily raise the final gas yield (FNR 2010, Ch. 3 “Triturado”).
Sources of the process data
- Hagos et al. (2017). Anaerobic co-digestion process for biogas production: progress, challenges and perspectives. Renew. Sustain. Energy Rev.
- Weiland, P. (2010) Biogas production: current state and perspectives. Applied Microbiology and Biotechnology
- Hendriks, Zeeman (2009). Pretreatments to enhance the digestibility of lignocellulosic biomass. Bioresour. Technol.
- Chen, Cheng, Creamer (2008). Inhibition of anaerobic digestion process: A review. Bioresour. Technol.
- FNR (2010). Guía sobre el Biogás – Desde la producción hasta el uso (hiszp. wydanie „Leitfaden Biogas”, GIZ 2013)
The co-digestion calculator will assess a specific mixture containing this substrate.
What it is and where it comes from
Green coffee, that is, raw beans before roasting, is cleaned and sorted in processing plants and roasteries. In this process dust and the so-called silverskin are separated off: the thin membrane surrounding the bean, which partly falls away already during wet or dry processing. Small but uniform waste streams arise at coffee packing or roasting plants. Coffee processing is well developed in Poland, although in overall terms the quantities of waste are small.
Properties relevant to digestion
Silverskin is lignocellulosic in nature: it contains cellulose, hemicellulose and lignin, as well as protein and small amounts of lipids. Dust contains bean fragments and is therefore sometimes richer in protein, fat and soluble compounds. Both fractions contain caffeine, chlorogenic acid and other polyphenols, which at high concentrations can affect microbial activity, although at typical shares in the feed this effect is limited. The material is dry, light and dusty, which makes feeding difficult, and the dust can pose an explosion hazard during dry handling.
How to read the spread of results
The dataset contains several records from a single study, carried out under mesophilic conditions: one for silverskin, another for dust. Both fractions gave similar results, which suggests that in this study the type of fraction was not the main source of variability. It is not known, however, whether this conclusion generalises to other batches. The results depend on the coffee variety (arabica, robusta), the method of bean processing, the degree of size reduction, moisture and the inoculum.
In biogas plant practice
Green coffee silverskin and dust can be added to co-digestion at a small share, preferably after wetting or mixing with a liquid fraction, for example slurry. Dry dust must be protected against becoming airborne. The material is stable and tolerates storage in dry conditions well, which makes it easier to plan deliveries. Waste from food processing is waste, so its acceptance requires appropriate authorisations, and if the material is sold as a by-product, a different legal regime applies. Because of the small quantity of material its effect on the plant's balance is limited, but it can be a valuable local supplement.
Methodology in brief
BMP is the amount of methane obtained from volatile solids (VS) in a batch test, given in m³ CH₄ per tonne of VS (numerically the same as NmL CH₄/g VS in the publications) and converted to normal conditions (0 °C, 101.325 kPa). The weighted mean gives each publication a total weight of 1, split equally between its results for the substrate — a paper testing twenty varieties does not outweigh a paper with a single sample. In inter-laboratory programmes the unit is the laboratory (total weight 1), and within it the weight of a test grows with the number of bottles (replicates). Results after pretreatment (e.g. thermal, chemical, enzymatic) are shown separately and are not included in the mean.
Solid lines are curves measured in the tests. Where a publication gives only the final result, we draw a first-order kinetic model, B(t) = B₀·(1 − e−kt): only the end point comes from the publication, and the shape of the curve serves purely as visualisation — do not read the production on a particular day from it. For this substrate k = 0.091 d−1 was assumed (no kinetic data for the group – the median of all available rate constants k (93 values) was used).
The statistics describe the spread of published results — a descriptive compilation, not a meta-analysis or a guarantee of plant yield.
Bibliography
- Velasquez-Pinas, J.A.; Ampese, L.C.; Di Domenico Ziero, H.; Radis Steinmetz, R.L.; Belt, C.; Forster-Carneiro, T. (2023). Circular bioeconomy of coffee industries: Energy and techno-economic approach based on biogas and biomethane production. Journal of Cleaner Production 418, 138045. DOI: 10.1016/j.jclepro.2023.138045 DOI
All sources of the site: bibliography.
Other substrates in the group “By-products of the agri-food industry”
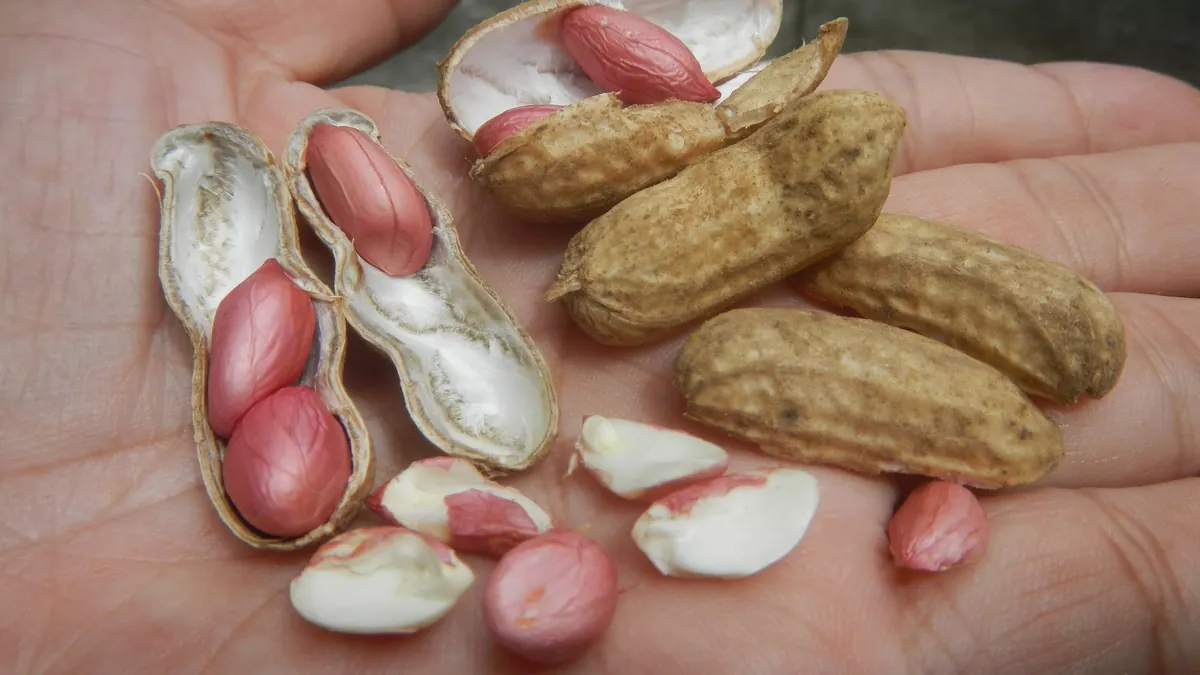
Peanut shells — BMP: 2 studies, weighted mean 50 m³ CH₄/t VS
50 m³ CH₄/t VS weighted mean from 2 studies
neutral — editorial rating for biogas plants≈52 %
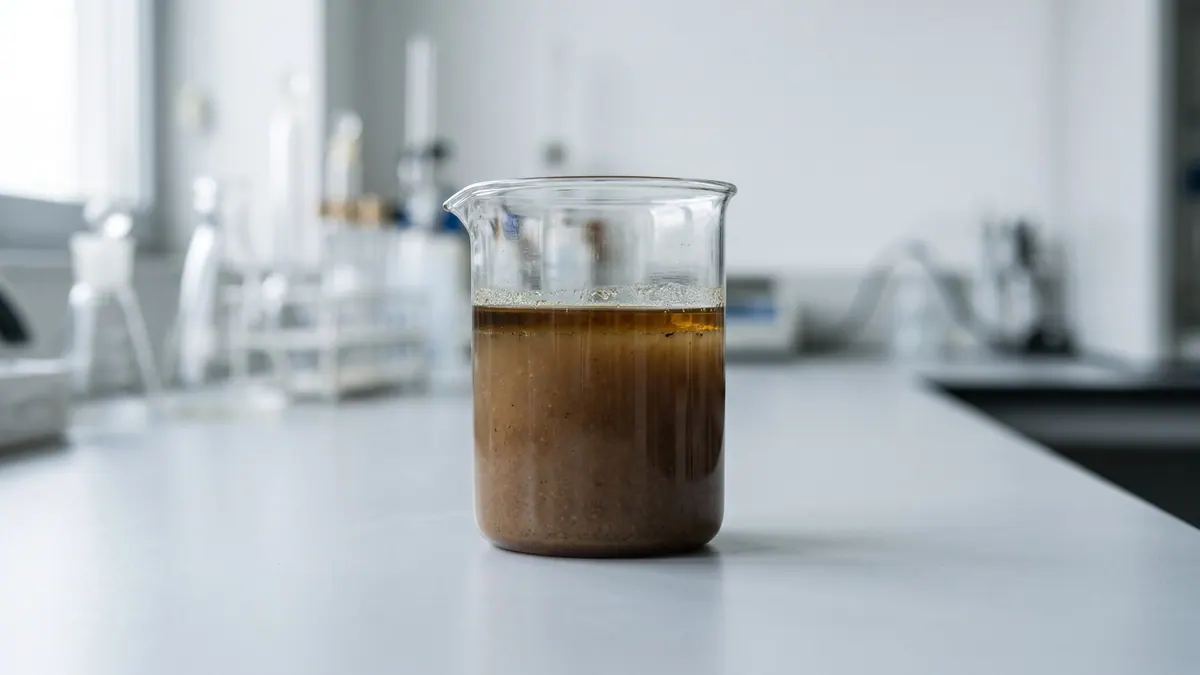
Palm oil mill effluent (POME) — BMP: 2 studies, weighted mean 431 m³ CH₄/t VS
431 m³ CH₄/t VS weighted mean from 2 studies
≈63 %
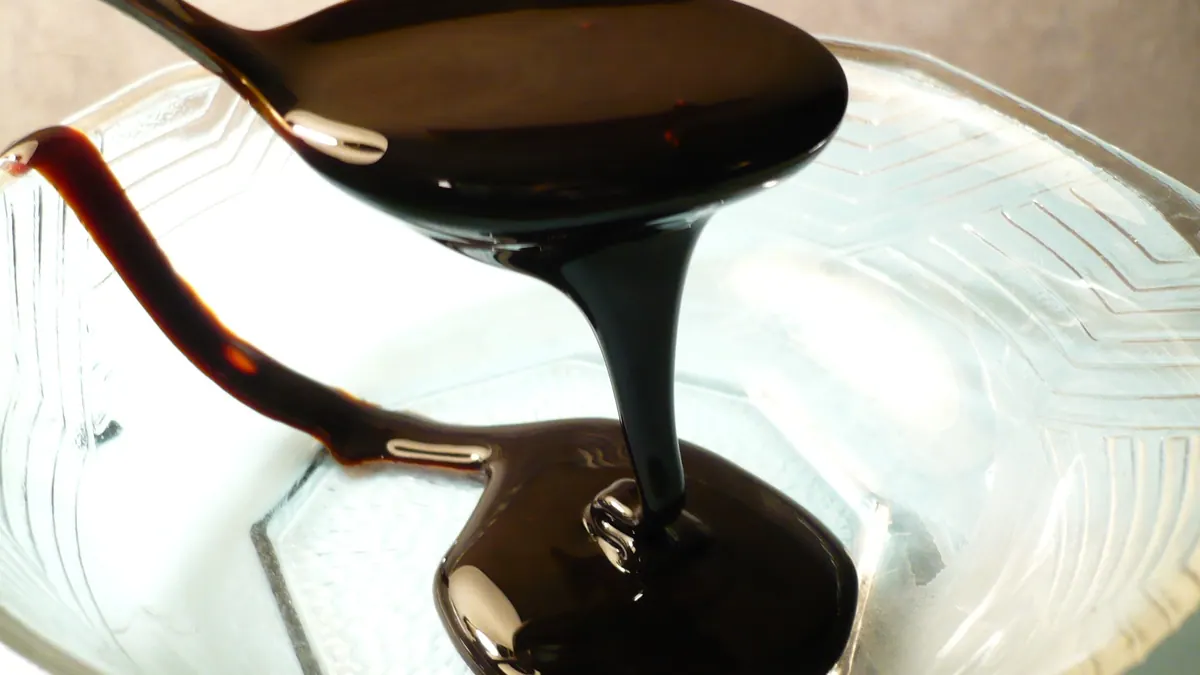
Molasses — BMP: 2 studies, weighted mean 410 m³ CH₄/t VS
410 m³ CH₄/t VS weighted mean from 2 studies
good — editorial rating for biogas plants≈52 %
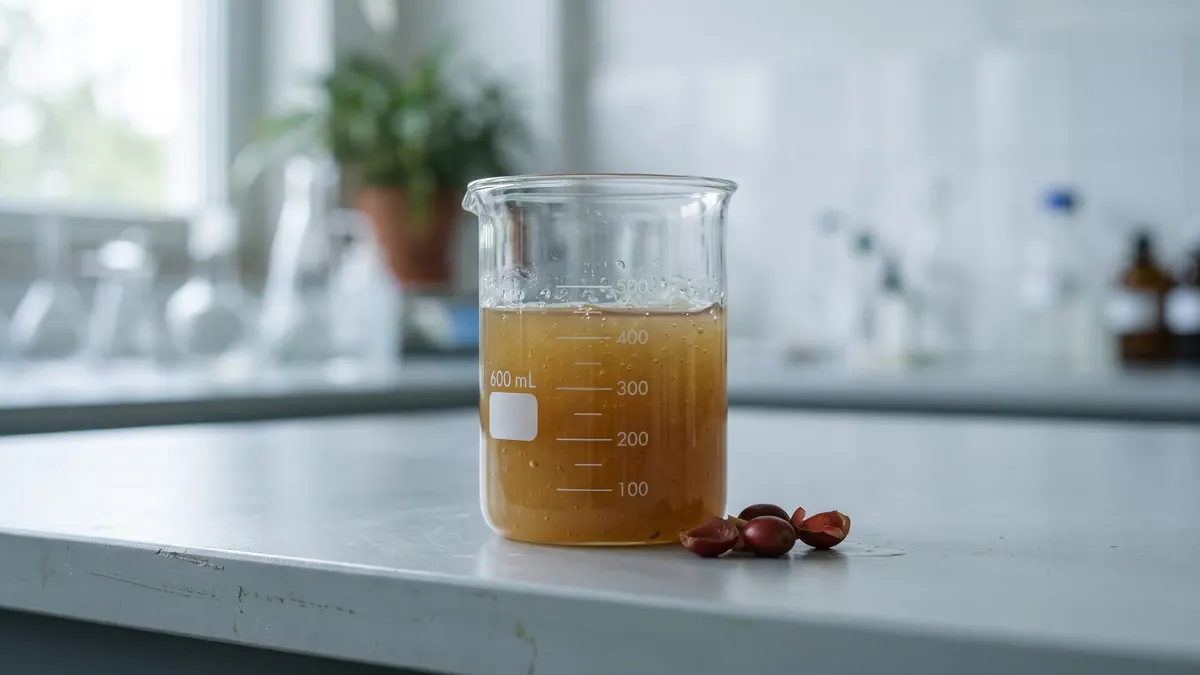
Coffee mucilage — BMP: 3 studies, weighted mean 279 m³ CH₄/t VS
279 m³ CH₄/t VS weighted mean from 3 studies
≈52 %