

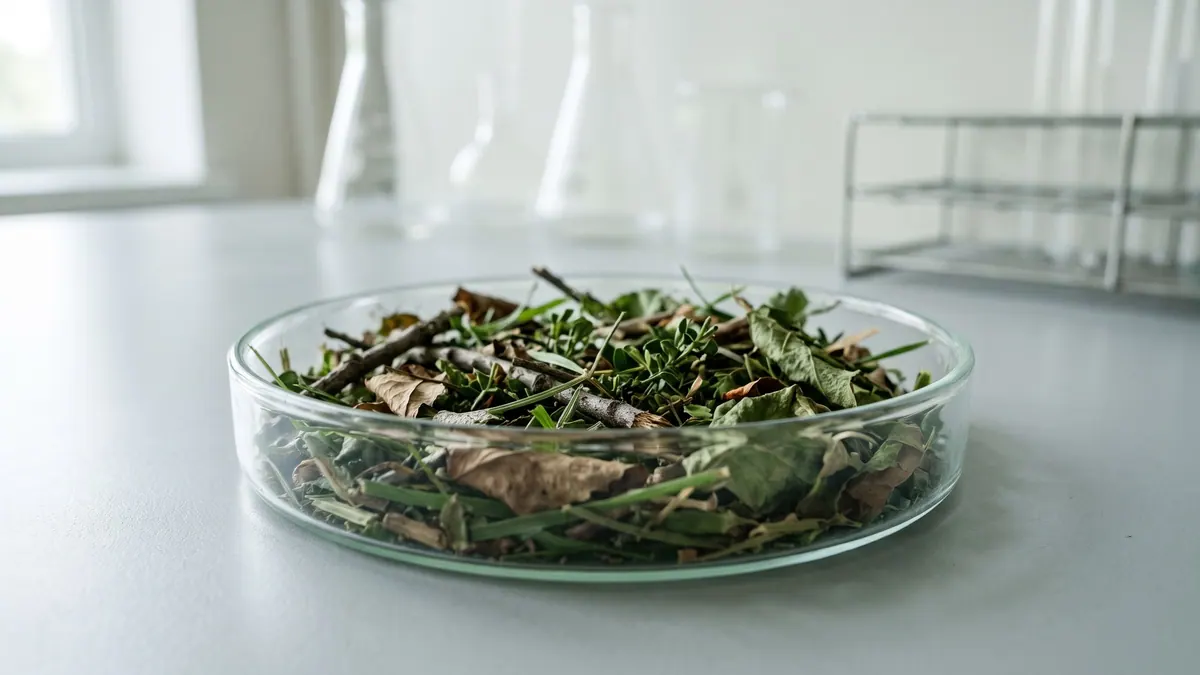
BMP testingMunicipal and green waste, paper and textiles
Green / yard waste — BMP: 11 studies, weighted mean 177 m³ CH₄/t VS
Green waste from the maintenance of green spaces (grass, leaves, branches) is seasonal; its potential depends on the month of collection and the share of the woody fraction.
rating: neutralCH₄ ≈ 52 % (estimate)
Illustration: FeedstockData (AI, Google Gemini)
- Weighted mean
- 177m³ CH₄/t VS
- Range
- 63–235m³ CH₄/t VS
- Records
- 11studies
- Publications
- 3sources
- Temperatures
- 37 °C, 38 °Cof the test
Methane in biogas
Medium methane content · ≈ 5.2 kWh/m³ of biogas
estimate from the substrate type The collected studies contain no measurement. The interval follows from the approximate composition (protein from total nitrogen (N 1.2 % DM × 6.25)) and the yields of compound groups according to FNR.
Rating for biogas plants
neutral — editorial rating for biogas plantsNo clear advantages — worth charging a fee for accepting it
Potential per tonne of fresh matter: moderate, but limited by the poor degradability of the organic matter (66 m³ CH₄/t); no particular threats to stability. Handling costs: sand, stones, shells, fibres, floating layer.
Why? Rating factors
Potential per tonne +1
- +1potential 66 m³ CH₄/t fresh matter (BMP 177 × DM 44.6 % × VS 83.3 %); low degradability of VS (BMP 177 m³ CH₄/t VS) — points capped
Process stability 0
- 0no factors
Handling and costs −1
- −0.5sand, stones, shells — sediment in the digester
- −0.5fibres, floating layer — shredding and intensive mixing
Total points: 0 · thresholds: ≥ 2.5 very good, ≥ 1 good, below — neutral; negative with cumulative process risk.
Add to the co-digestion calculator CSV data
BMP curves from 11 studies
Weighted mean Individual records
Dashed lines are a model curve (first-order kinetics, B(t) = B₀·(1 − e−kt)); the end point comes from the publication. All curves are model curves.
Cumulative methane production over the test [m³ CH₄/t VS]. The thick line is the weighted mean of all records (177); dots mark the end values given in the publications. Point at the chart to read values; click a legend item to hide or show a record.
Records and sources
Download CSV| Source | BMP m³ CH₄/t VS | Temperature | Sample | Curve |
|---|---|---|---|---|
| Holliger et al. (2017) · 1 DOI | 103 | — | Green waste — December | end point (model curve) |
| Holliger et al. (2017) · 2 DOI | 147 | — | Green waste — March | end point (model curve) |
| Holliger et al. (2017) · 3 DOI | 156 | — | Green waste — April | end point (model curve) |
| Holliger et al. (2017) · 4 DOI | 207 | — | Green waste — May | end point (model curve) |
| Holliger et al. (2017) · 5 DOI | 227 | — | Green waste — July | end point (model curve) |
| Holliger et al. (2017) · 6 DOI | 235 | — | Green waste — June | end point (model curve) |
| Lallement et al. (2023) · 1 DOI | 63 | 38 °C · mesophilic | green waste | end point (model curve) |
| Lallement et al. (2023) · 2 DOI | 178 | 38 °C · mesophilic | green waste | end point (model curve) |
| Lallement et al. (2023) · 3 DOI | 212 | 38 °C · mesophilic | green waste | end point (model curve) |
| Lallement et al. (2023) · 4 DOI | 219 | 38 °C · mesophilic | green waste | end point (model curve) |
| Li et al. (2013) DOI | 183 | 37 °C · mesophilic | Yard waste | end point (model curve) |
| Weighted mean | 177 | arithmetic mean 176, SD 54 | ||
Typical composition
- Dry matter (DM)
- 44.6% (range 34.4–80.6)
- Volatile solids (VS)
- 83.3 % DM (range 77–93)
- Nitrogen
- 1.2 % DM
- C/N ratio
- 26.2
Median and range of the determinations reported in the publications behind this substrate's BMP records (read from: MY-D); dry matter: 5 determinations, volatile solids: 3 determinations. C/N was calculated as the ratio of C and N content (% DM) from the same source. The DM range includes fresh samples as well as samples partly dried or dried before the test – for fresh material the lower part of the range applies, ideally your own measurement.
Sources: Lallement et al. (2023); Li et al. (2013).
The composition of the raw material varies between batches — for plant calculations use an analysis of your own sample. The calculator inserts typical values automatically.
Process properties
Low confidence: the description is based on general characteristics of the substrate group, not on studies of this material. Treat it as a hint to be verified.
Advantages
- Methane potential in the Substraty.pl BMP dataset: weighted mean 176.7 m³ CH₄/t VS (SD 54.4; 11 records, 3 sources).
- A seasonally available waste, potential depends on the month (Weiland 2010).
Drawbacks and risks
- Woody fractions degrade poorly (Hendriks and Zeeman 2009).
- Soil and stones require screening.
Co-digestion — what to combine it with, what to watch out for
- combines well
substrates: high alkalinity (buffer) — e.g. Cattle manure, Pig slurry, Cattle slurry, Duck slurry, Rumen and digestive tract content
Dosing
No source threshold.
Introduce gradually, starting with a small dose and monitoring the process (e.g. FOS/TAC, pH, gas composition).
Practical requirements
- Shred: shredding increases the surface available for degradation and speeds it up, but does not necessarily raise the final gas yield (FNR 2010, Ch. 3 “Triturado”).
Sources of the process data
- Hagos et al. (2017). Anaerobic co-digestion process for biogas production: progress, challenges and perspectives. Renew. Sustain. Energy Rev.
- Weiland (2010). Biogas production: current state and perspectives. Appl. Microbiol. Biotechnol.
- Hendriks, Zeeman (2009). Pretreatments to enhance the digestibility of lignocellulosic biomass. Bioresour. Technol.
- FNR (2010). Guía sobre el Biogás – Desde la producción hasta el uso (hiszp. wydanie „Leitfaden Biogas”, GIZ 2013)
The co-digestion calculator will assess a specific mixture containing this substrate.
What it is and where it comes from
Green waste arises from the maintenance of parks, gardens, squares, cemeteries and road verges. It includes cut grass, leaves, weeds, shoots and branches. Green space managers and municipal companies collect it and send it to composting plants or biogas plants. The dataset includes samples of waste from different months of the year (from December to July), which makes it possible to see the effect of season on methane potential.
Properties relevant to digestion
The composition changes with the time of year: in spring and early summer young shoots and grass with a high content of readily available carbohydrates and protein predominate, while in autumn leaves and woody stems rich in lignin are added. Branches and thick pieces of wood hardly degrade at all. Dry matter is moderate or high, and the material needs size reduction because the fibres form a floating layer. Typical impurities are soil, stones, sand and litter. Grass spoils quickly after cutting, so long storage lowers the potential.
How to read the spread of results
The spread is large because the entry combines materials collected in different months, from different places and with different shares of grass, leaves and wood. The month of collection is one of the most important factors here. Storage, size reduction, temperature, inoculum and test duration also matter. Records from different months should not be merged into a single "typical value", although the builder displays them together.
In biogas plant practice
Green waste is valuable as an addition to municipal biowaste and to nitrogen-rich substrates, especially in the growing season. It requires screening out impurities, size reduction and, where appropriate, ensiling to even out availability over the year. Branches are better sent for composting or combustion. Green waste belongs to waste group 20, and its acceptance requires plant permits.
For logistics planners it is important that deliveries of green waste are uneven: the largest in May, June and autumn. A buffer in the form of a silage clamp or a tank allows the inflow to be evened out, and rapid processing limits losses and odour nuisance.
When deliveries are seasonal, ensiling can help, as it preserves most of the potential.
Methodology in brief
BMP is the amount of methane obtained from volatile solids (VS) in a batch test, given in m³ CH₄ per tonne of VS (numerically the same as NmL CH₄/g VS in the publications) and converted to normal conditions (0 °C, 101.325 kPa). The weighted mean gives each publication a total weight of 1, split equally between its results for the substrate — a paper testing twenty varieties does not outweigh a paper with a single sample. In inter-laboratory programmes the unit is the laboratory (total weight 1), and within it the weight of a test grows with the number of bottles (replicates). Results after pretreatment (e.g. thermal, chemical, enzymatic) are shown separately and are not included in the mean.
Solid lines are curves measured in the tests. Where a publication gives only the final result, we draw a first-order kinetic model, B(t) = B₀·(1 − e−kt): only the end point comes from the publication, and the shape of the curve serves purely as visualisation — do not read the production on a particular day from it. For this substrate k = 0.110 d−1 was assumed (median of rate constants k reported in the sources and/or fitted to the mean measured curves).
The statistics describe the spread of published results — a descriptive compilation, not a meta-analysis or a guarantee of plant yield.
Bibliography
- Holliger, C.; Fruteau de Laclos, H.; Hack, G. (2017). Methane Production of Full-Scale Anaerobic Digestion Plants Calculated from Substrate’s Biomethane Potentials Compares Well with the One Measured On-Site. Frontiers in Energy Research 5, 12. DOI: 10.3389/fenrg.2017.00012 DOI
- Lallement, A.; Peyrelasse, C.; Lagnet, C.; Barakat, A.; Schraauwers, B.; Maunas, S.; Monlau, F. (2023). A Detailed Database of the Chemical Properties and Methane Potential of Biomasses Covering a Large Range of Common Agricultural Biogas Plant Feedstocks. Waste 1(1), 195–227. DOI: 10.3390/waste1010014 DOI
- Li, Y.; Zhang, R.; Liu, G.; Chen, C.; He, Y.; Liu, X. (2013). Comparison of methane production potential, biodegradability, and kinetics of different organic substrates. Bioresource Technology 149, 565–569. DOI: 10.1016/j.biortech.2013.09.063 DOI
All sources of the site: bibliography.
Other substrates in the group “Municipal and green waste, paper and textiles”
Organic fraction of municipal solid waste — BMP: 13 studies, weighted mean 187 m³ CH₄/t VS
187 m³ CH₄/t VS weighted mean from 13 studies
neutral — editorial rating for biogas plants≈58 %
Mixed paper waste (corrugated board + tissue) — BMP: 5 studies, weighted mean 301 m³ CH₄/t VS
301 m³ CH₄/t VS weighted mean from 5 studies
≈52 %

Magazine paper — BMP: 6 studies, weighted mean 243 m³ CH₄/t VS
243 m³ CH₄/t VS weighted mean from 6 studies
good — editorial rating for biogas plants≈51 %

Office paper — BMP: 9 studies, weighted mean 314 m³ CH₄/t VS
314 m³ CH₄/t VS weighted mean from 9 studies
good — editorial rating for biogas plants≈51 %