

BMP testingFruit, vegetables and their residues
Cauliflower leaves and stems — BMP: 8 studies, weighted mean 336 m³ CH₄/t VS
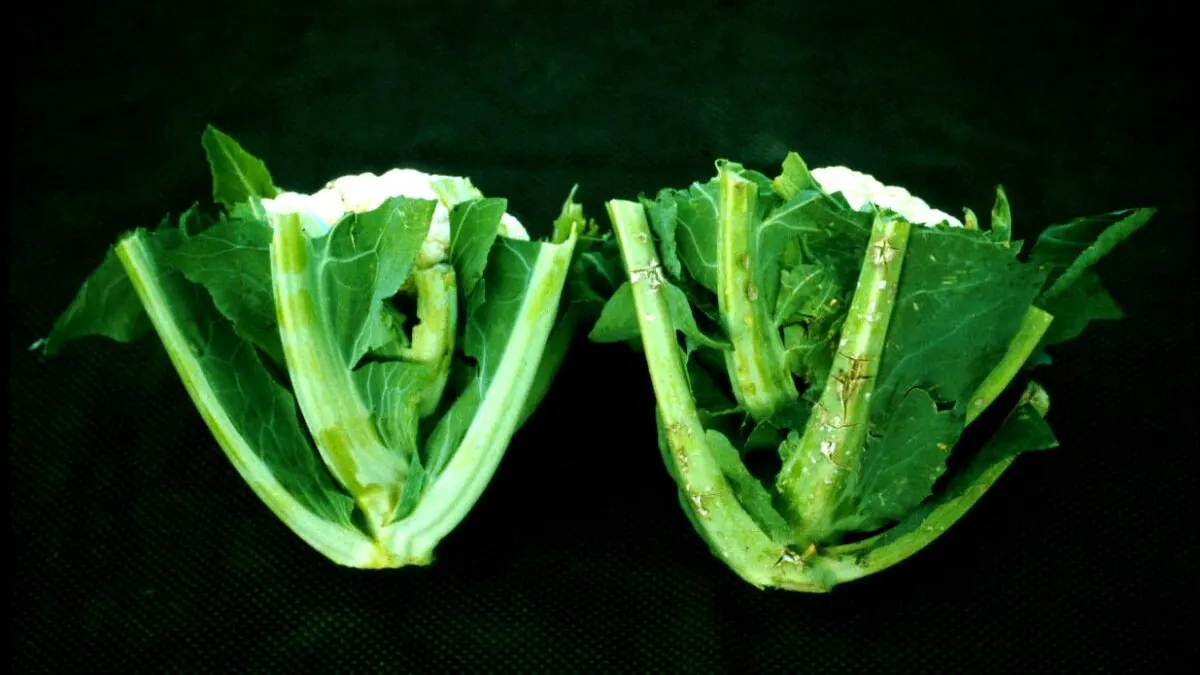
Cauliflower leaves and stems are a watery crop residue from brassicas, readily fermentable, but with a clear potential for hydrogen sulphide formation in the biogas.
Photo Schlaghecken Josef / Wikimedia Commons, licence CC BY 4.0, source file; changes: cropping

- Weighted mean
- 336m³ CH₄/t VS
- Range
- 190–423m³ CH₄/t VS
- Records
- 8studies
- Publications
- 3sources
- Temperatures
- 35 °C, 37 °Cof the test
Methane in biogas
High methane content · ≈ 6.8 kWh/m³ of biogas
measured mean of 2 studies BMP, range 67.6–67.7 %; in a batch test the CH₄ share tends to be higher than in a plant.
Rating for biogas plants
neutral — editorial rating for biogas plantsNo clear advantages — worth charging a fee for accepting it
Potential per tonne of fresh matter: moderate (46 m³ CH₄/t); process risk: acidification. Handling costs: fibres, floating layer.
Why? Rating factors
Potential per tonne +1
- +1potential 46 m³ CH₄/t fresh matter (BMP 336 × DM 16.2 % × VS 83.7 %)
Process stability −1
- −1acidification: rapid degradation / acidic pH, risk of VFA accumulation, needs buffering
Handling and costs −0.5
- −0.5fibres, floating layer — shredding and intensive mixing
Total points: −0.5 · thresholds: ≥ 2.5 very good, ≥ 1 good, below — neutral; negative with cumulative process risk.
Add to the co-digestion calculator CSV data
BMP curves from 8 studies
Weighted mean Individual records
Dashed lines are a model curve (first-order kinetics, B(t) = B₀·(1 − e−kt)); the end point comes from the publication. All curves are model curves.
Cumulative methane production over the test [m³ CH₄/t VS]. The thick line is the weighted mean of all records (336); dots mark the end values given in the publications. Point at the chart to read values; click a legend item to hide or show a record.
Records and sources
Download CSV| Source | BMP m³ CH₄/t VS | CH₄ in biogas % vol., measured | Temperature | Sample | Curve |
|---|---|---|---|---|---|
| Sharma et al. (1988) · 1 DOI | 358 | — | 37 °C · mesophilic | Cauiliflower · pretreatment: Material were first dried in the sun and then in an oven at 90oC | end point (model curve) |
| Sharma et al. (1988) · 2 DOI | 407 | — | 37 °C · mesophilic | Cauiliflower · pretreatment: Material were first dried in the sun and then in an oven at 90oC | end point (model curve) |
| Sharma et al. (1988) · 3 DOI | 420 | — | 37 °C · mesophilic | Cauiliflower · pretreatment: Material were first dried in the sun and then in an oven at 90oC | end point (model curve) |
| Sharma et al. (1988) · 4 DOI | 423 | — | 37 °C · mesophilic | Cauiliflower · pretreatment: Material were first dried in the sun and then in an oven at 90oC | end point (model curve) |
| Zubr (1986) · 1 DOI | 341 | 67.7 % | 35 °C · mesophilic | Cauliflower · pretreatment: Silage: Air tight glass jars , fermented 30-40 days at 20 oC. | end point (model curve) |
| Zubr (1986) · 2 DOI | 352 | 67.6 % | 35 °C · mesophilic | Cauliflower | end point (model curve) |
| Gunaseelan (2004) · 1 DOI | 190 | — | 35 °C · mesophilic | cauliflower Leaves | end point (model curve) |
| Gunaseelan (2004) · 2 DOI | 331 | — | 35 °C · mesophilic | cauliflower stems | end point (model curve) |
| Weighted mean | 336 | 67.7 % | arithmetic mean 353, SD 75 | ||
Typical composition
- Dry matter (DM)
- 16.2% (range 11.2–21.2)
- Volatile solids (VS)
- 83.7 % DM (range 82–87.1)
- C/N ratio
- 11.6
Median and range of the determinations reported in the publications behind this substrate's BMP records (read from: CROPGEN D4, MY-D); dry matter: 2 determinations, volatile solids: 4 determinations.
Sources: Sharma et al. (1988); Zubr (1986); Gunaseelan (2004).
The composition of the raw material varies between batches — for plant calculations use an analysis of your own sample. The calculator inserts typical values automatically.
Process properties
Advantages
- Methane yield in the compendium: median 355 (range 190-423) m³ CH₄/t VS, 8 records from 3 studies (weighted mean 336).
- Particle size affected biogas production from plant residues, including vegetable waste (Sharma et al. (1988))
Co-digestion — what to combine it with, what to watch out for
- combines well
substrates: nitrogen-rich — e.g. Pig slurry, Poultry manure, Waste activated sludge (secondary sludge), Chlorella vulgaris, Nannochloropsis salina
A nitrogen-rich co-substrate balances the low C/N of fruit and vegetable waste (Bouallagui et al. 2009).[1]
Dosing
No source limits on the dose for this substrate.
Introduce gradually, starting with a small dose and monitoring the process (e.g. FOS/TAC, pH, gas composition).
Sources of the process data
- Improvement of fruit and vegetable waste anaerobic digestion performance and stability with co-substrates addition
- Effect of particle size on biogas generation from biomass residues
- Methanogenic fermentation of fresh and ensiled plant materials
- Biochemical methane potential of fruits and vegetable solid waste feedstocks
- Effects of size and thermophilic pre-hydrolysis of banana peel during anaerobic digestion, and biomethanation potential of key tropical fruit wastes
The co-digestion calculator will assess a specific mixture containing this substrate.
What it is and where it comes from
The outer leaves and stems of cauliflower are the largest part of the plant's biomass that does not go to sale. They arise in the field during harvest and in packing houses, where the florets are cleaned of their leaf covering. In agricultural practice they are ploughed in or left to decompose, which makes them a natural candidate for co-digestion in a biogas plant in vegetable-growing regions.
Properties relevant to digestion
Leaves and stems have a higher fibre content (cellulose, hemicellulose) than the florets alone, and lignin remains low, although it rises in older stems. The material is very watery, with a high content of sugars and protein in the leaves. Like other brassicas it contains sulphur compounds, so digestion may be accompanied by a rise in H₂S concentration. Stems can create mechanical problems, because long fibres wrap around agitators and block pumps if the material has not been well size-reduced. Contamination with soil and sand after field harvest is also a potential risk.
How to read the spread of results
The dataset contains several records from several sources. In one of them cauliflower leaves were tested in different size-reduction fractions, which is an important source of variability: finer fractions usually release gas faster, and the final result also depends on test length. In addition, the results depend on the harvest date, the share of leaves and stems, on whether the sample was fresh, frozen or dried, and on the inoculum used. For these reasons the spread reflects primarily differences in sample preparation.
In biogas plant practice
Cauliflower residues are best combined with slurry or silage, which provide buffer and structure. They should be size-reduced and dosed gradually, and the installation should have a working desulphurisation system. Storage in a clamp without ensiling leads to losses and unpleasant odours, so prompt use or ensiling is advisable. Seasonality and the wide dispersion of sources complicate logistics, and the cost of transporting watery biomass is sometimes a barrier. As plant waste from agricultural production and processing, it is subject to the relevant waste acceptance regulations.
Collecting a fraction from a single source, for example from a packing house, is also a good supplement, because then the composition of the batch is more predictable and the dose can be chosen on the basis of a dry matter measurement.
Methodology in brief
BMP is the amount of methane obtained from volatile solids (VS) in a batch test, given in m³ CH₄ per tonne of VS (numerically the same as NmL CH₄/g VS in the publications) and converted to normal conditions (0 °C, 101.325 kPa). The weighted mean gives each publication a total weight of 1, split equally between its results for the substrate — a paper testing twenty varieties does not outweigh a paper with a single sample. In inter-laboratory programmes the unit is the laboratory (total weight 1), and within it the weight of a test grows with the number of bottles (replicates). Results after pretreatment (e.g. thermal, chemical, enzymatic) are shown separately and are not included in the mean.
Solid lines are curves measured in the tests. Where a publication gives only the final result, we draw a first-order kinetic model, B(t) = B₀·(1 − e−kt): only the end point comes from the publication, and the shape of the curve serves purely as visualisation — do not read the production on a particular day from it. For this substrate k = 0.245 d−1 was assumed (median of rate constants k reported in the sources and/or fitted to the mean measured curves).
The statistics describe the spread of published results — a descriptive compilation, not a meta-analysis or a guarantee of plant yield.
Bibliography
- Sharma, S.K.; Mishra, I.; Sharma, M.; Saini, J. (1988). Effect of particle size on biogas generation from biomass residues. Biomass 17(4), 251–263. DOI: 10.1016/0144-4565(88)90107-2 DOI
- Zubr, J. (1986). Methanogenic fermentation of fresh and ensiled plant materials. Biomass 11(3), 159–171. DOI: 10.1016/0144-4565(86)90064-8 DOI
- Gunaseelan, V. (2004). Biochemical methane potential of fruits and vegetable solid waste feedstocks. Biomass and Bioenergy 26(4), 389–399. DOI: 10.1016/j.biombioe.2003.08.006 DOI
All sources of the site: bibliography.
Other substrates in the group “Fruit, vegetables and their residues”
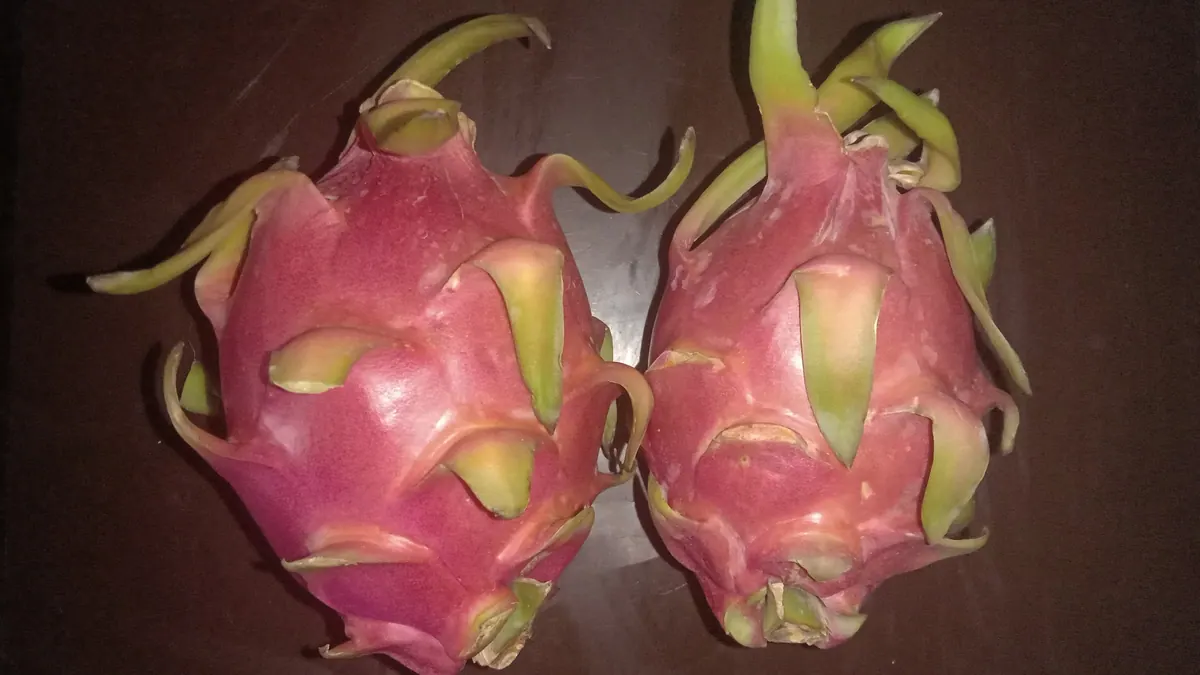
Dragon fruit (pitaya) peels — BMP: 3 studies, weighted mean 87 m³ CH₄/t VS
87 m³ CH₄/t VS weighted mean from 3 studies
≈53 %
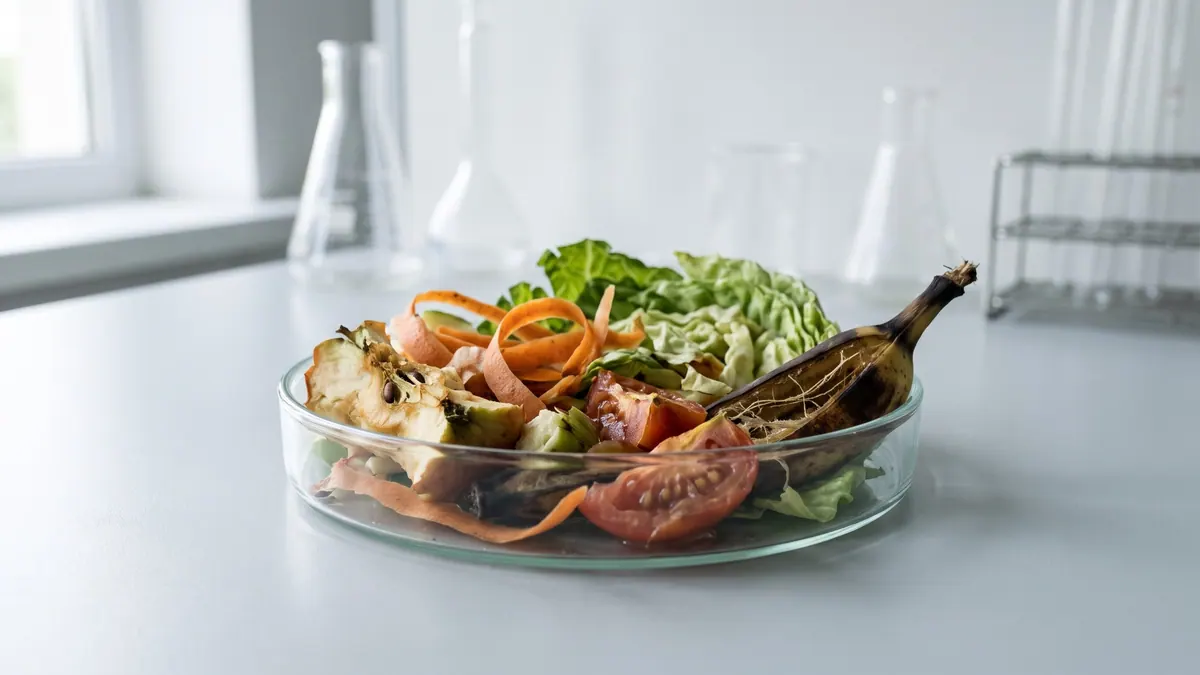
Fruit and vegetable waste (mixed) — BMP: 5 studies, weighted mean 305 m³ CH₄/t VS
305 m³ CH₄/t VS weighted mean from 5 studies
neutral — editorial rating for biogas plants≈55 %
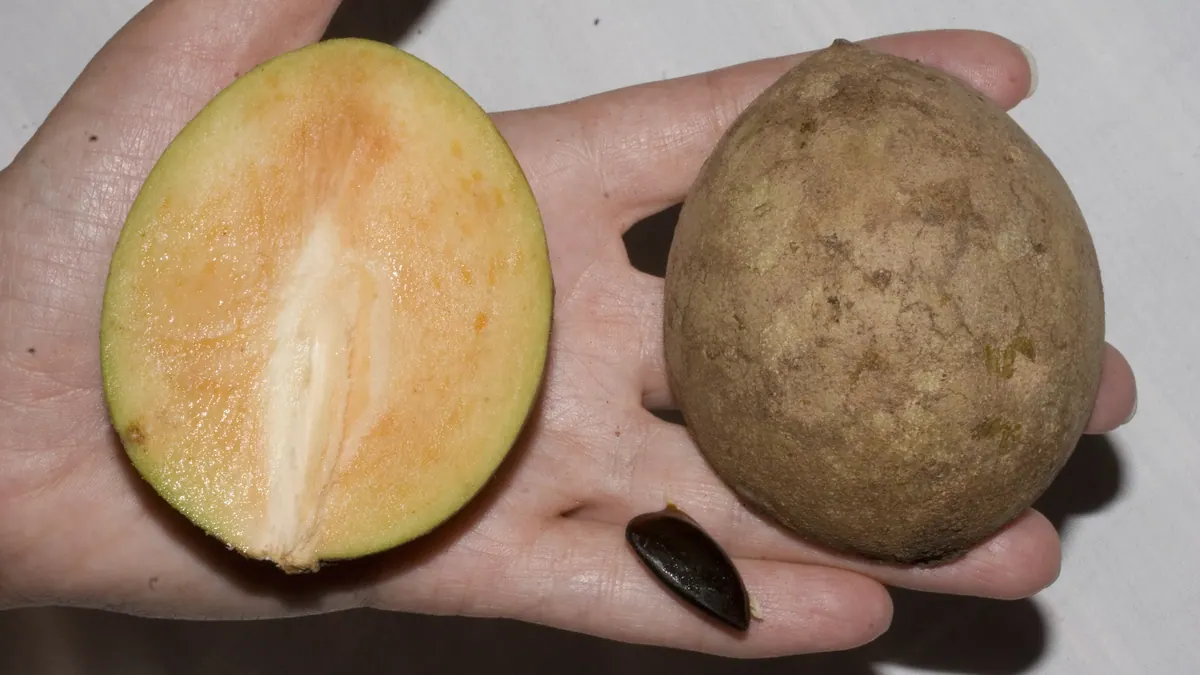
Sapodilla fruit and peels — BMP: 2 studies, weighted mean 286 m³ CH₄/t VS
286 m³ CH₄/t VS weighted mean from 2 studies
≈52 %
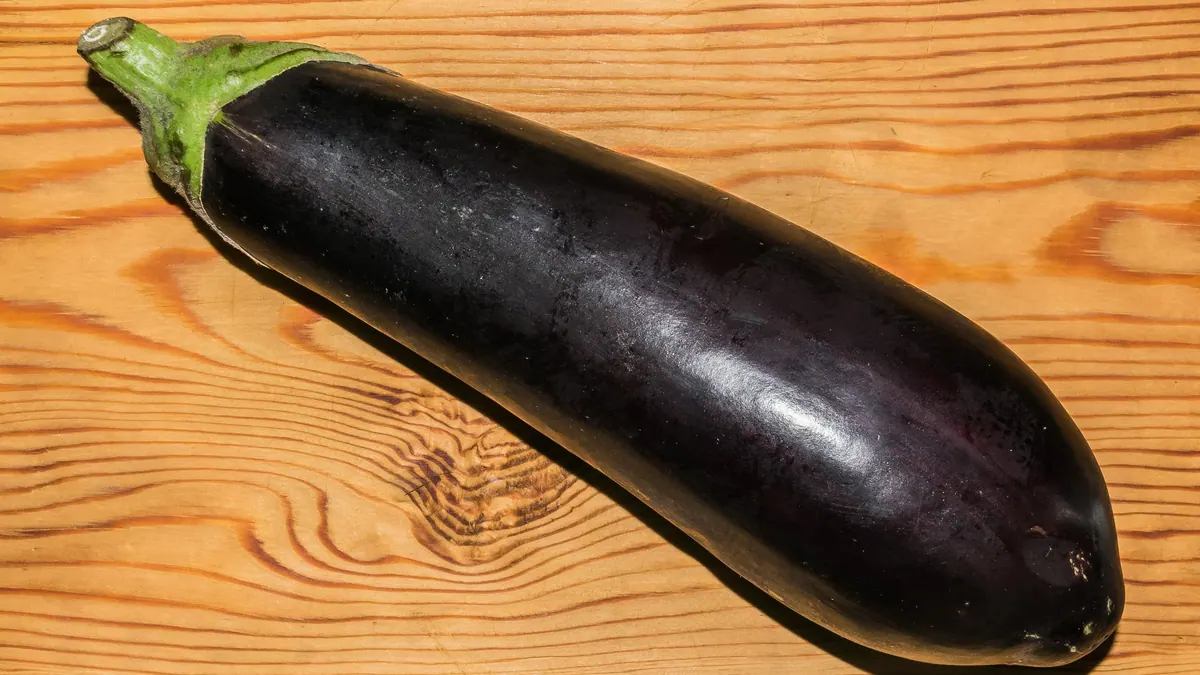
Eggplant (fruit) — BMP: 2 studies, weighted mean 333 m³ CH₄/t VS
333 m³ CH₄/t VS weighted mean from 2 studies
≈54 %