

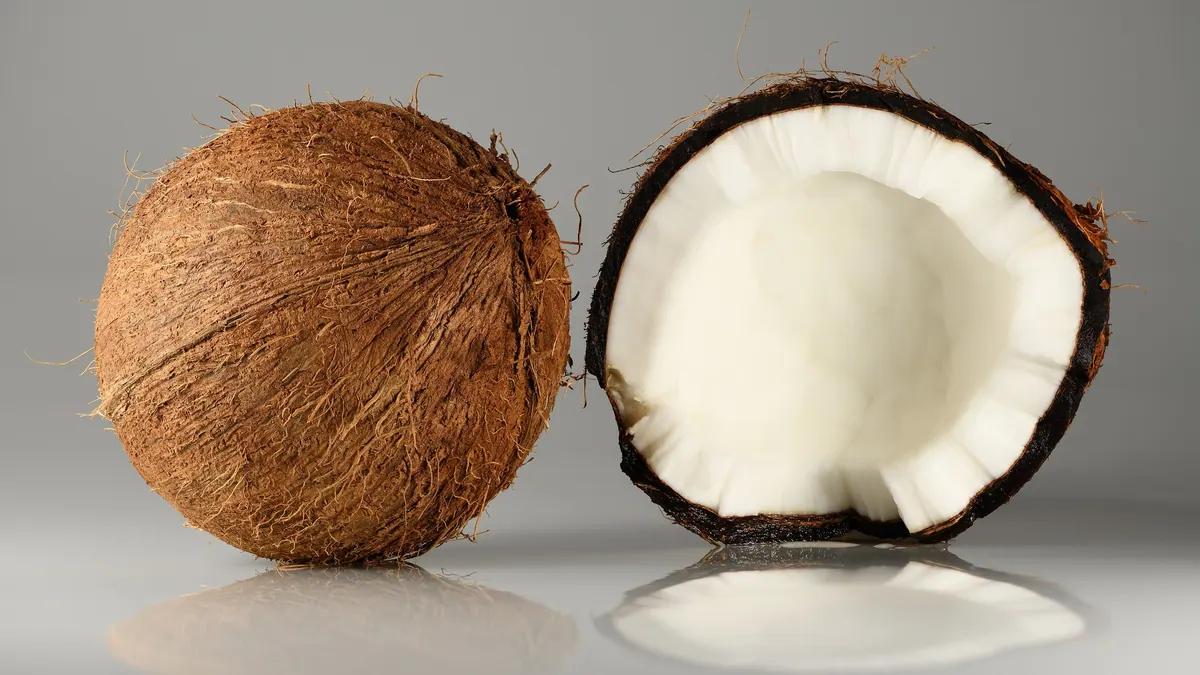
BMP testingBy-products of the agri-food industry
Coconut meal / oil cake — BMP: 3 studies, weighted mean 296 m³ CH₄/t VS
Coconut cake (meal) is a residue from pressing copra, rich in fibre and residual fat; results from several studies are moderately consistent.
Photo Ivar Leidus / Wikimedia Commons, licence CC BY-SA 4.0, source file; changes: cropping

- Weighted mean
- 296m³ CH₄/t VS
- Range
- 262–383m³ CH₄/t VS
- Records
- 3studies
- Publications
- 2sources
- Temperatures
- 35 °Cof the test
Methane in biogas
High methane content · ≈ 6.6 kWh/m³ of biogas
estimate from the substrate type The collected studies contain no measurement. The interval follows from the approximate composition (protein-rich (process classification); fat-rich (process classification)) and the yields of compound groups according to FNR.
Rating for biogas plants
not rated — editorial rating for biogas plants
Not rated: no dry matter or volatile solids in the data. We calculate the rating when the dry matter and volatile solids of the material are known.
Add to the co-digestion calculator CSV data
BMP curves from 3 studies
Weighted mean Individual records
Dashed lines are a model curve (first-order kinetics, B(t) = B₀·(1 − e−kt)); the end point comes from the publication. All curves are model curves.
Cumulative methane production over the test [m³ CH₄/t VS]. The thick line is the weighted mean of all records (296); dots mark the end values given in the publications. Point at the chart to read values; click a legend item to hide or show a record.
Records and sources
Download CSV| Source | BMP m³ CH₄/t VS | Temperature | Sample | Curve |
|---|---|---|---|---|
| Kouas et al. (2017) DOI | 262 | 35 °C · mesophilic | cocnut meal | end point (model curve) |
| Prabhudessai et al. (2013) · 1 DOI | 277 | — | Coconut oil cake | end point (model curve) |
| Prabhudessai et al. (2013) · 2 DOI | 383 | — | Coconut oil cake | end point (model curve) |
| Weighted mean | 296 | arithmetic mean 307, SD 66 | ||
Process properties
Low confidence: the description is based on general characteristics of the substrate group, not on studies of this material. Treat it as a hint to be verified.
Advantages
- Methane potential in the Substraty.pl BMP dataset: weighted mean 296.0 m³ CH₄/t VS (SD 66.0; 3 records, 2 sources).
- Dry and well stored; fibre and residual fat (Hendriks and Zeeman 2009).
Drawbacks and risks
- Residual coconut fat (lauric acid) may inhibit at a high dose (Long et al. 2012).
- Protein -> ammonia.
Co-digestion — what to combine it with, what to watch out for
- combines well
substrates: high alkalinity (buffer) — e.g. Cattle manure, Pig slurry, Cattle slurry, Duck slurry, Rumen and digestive tract content
Slurry supplies N and alkalinity, balancing the high C/N of the material.[1][2]
Dosing
No source threshold.
Introduce gradually, starting with a small dose and monitoring the process (e.g. FOS/TAC, pH, gas composition).
Practical requirements
- Shred: shredding increases the surface available for degradation and speeds it up, but does not necessarily raise the final gas yield (FNR 2010, Ch. 3 “Triturado”).
Sources of the process data
- Hagos et al. (2017). Anaerobic co-digestion process for biogas production: progress, challenges and perspectives. Renew. Sustain. Energy Rev.
- Weiland, P. (2010) Biogas production: current state and perspectives. Applied Microbiology and Biotechnology
- Hendriks, Zeeman (2009). Pretreatments to enhance the digestibility of lignocellulosic biomass. Bioresour. Technol.
- Long et al. (2012). Anaerobic co-digestion of fat, oil, and grease (FOG): A review of gas production and process limitations. Process Saf. Environ. Prot.
- Rajagopal, Masse, Singh (2013). A critical review on inhibition of anaerobic digestion process by excess ammonia. Bioresour. Technol.
- FNR (2010). Guía sobre el Biogás – Desde la producción hasta el uso (hiszp. wydanie „Leitfaden Biogas”, GIZ 2013)
The co-digestion calculator will assess a specific mixture containing this substrate.
What it is and where it comes from
Coconut cake (copra meal) is a by-product of pressing coconut oil from copra, that is, the dried flesh of the coconut. It arises in oil-producing countries such as the Philippines, Indonesia, India and Sri Lanka, and in Europe it is imported as a feed ingredient. There is no production in Poland, so as a biogas substrate it is practically unavailable, and the data remain comparative material for plant oil cakes.
Properties relevant to digestion
The cake contains fibre (cellulose, hemicellulose, mannans), protein, residual fat and small amounts of sugars. The lignin content is moderate. Coconut fat is rich in medium-chain acids, mainly lauric acid, which in free form and at high concentration can inhibit microorganisms, but the residual content in the cake is small. The material is dry and stores well, which eases logistics. The protein content raises the nitrogen share, so the ammonia risk is moderate at high doses.
How to read the spread of results
The dataset contains several records from several sources: coconut meal (with a mesophilic condition stated) and cake in records with no temperature given. The spread results from the pressing technology and the residual fat, the quality of the copra, comminution and sample preparation, and from the inoculum. Meal and cake may differ in oil content, which changes the result.
In biogas plant practice
Coconut cake, where available, can be added to co-digestion at a limited share, after grinding, together with slurry or silage. pH and volatile acids should be observed. Given its price as feed, it is rarely used, and its energy use makes sense mainly in producing countries, where it is a local waste. In Poland it has no practical significance.
If the coconut cake comes from a local press, its composition may change depending on the batch of copra and the pressing temperature, so before implementation it is worth running a BMP test and an analysis of dry matter and fat content.
For installations that might consider importing such a material, the economic balance is usually unfavourable, because the cake has a high value as protein-fibre feed, and the cost of sea transport and delivery to the biogas plant exceeds the gain from the additional biogas.
Methodology in brief
BMP is the amount of methane obtained from volatile solids (VS) in a batch test, given in m³ CH₄ per tonne of VS (numerically the same as NmL CH₄/g VS in the publications) and converted to normal conditions (0 °C, 101.325 kPa). The weighted mean gives each publication a total weight of 1, split equally between its results for the substrate — a paper testing twenty varieties does not outweigh a paper with a single sample. In inter-laboratory programmes the unit is the laboratory (total weight 1), and within it the weight of a test grows with the number of bottles (replicates). Results after pretreatment (e.g. thermal, chemical, enzymatic) are shown separately and are not included in the mean.
Solid lines are curves measured in the tests. Where a publication gives only the final result, we draw a first-order kinetic model, B(t) = B₀·(1 − e−kt): only the end point comes from the publication, and the shape of the curve serves purely as visualisation — do not read the production on a particular day from it. For this substrate k = 0.091 d−1 was assumed (no kinetic data for the group – the median of all available rate constants k (93 values) was used).
The statistics describe the spread of published results — a descriptive compilation, not a meta-analysis or a guarantee of plant yield.
Bibliography
- Kouas, M.; Torrijos, M.; Sousbie, P.; Steyer, J.P.; Sayadi, S.; Harmand, J. (2017). Robust assessment of both biochemical methane potential and degradation kinetics of solid residues in successive batches. Waste Management 70, 59–70. DOI: 10.1016/j.wasman.2017.09.001 DOI
- Prabhudessai, V.; Ganguly, A.; Mutnuri, S. (2013). Biochemical Methane Potential of Agro Wastes. Journal of Energy 2013, 1–7. DOI: 10.1155/2013/350731 DOI
All sources of the site: bibliography.
Other substrates in the group “By-products of the agri-food industry”
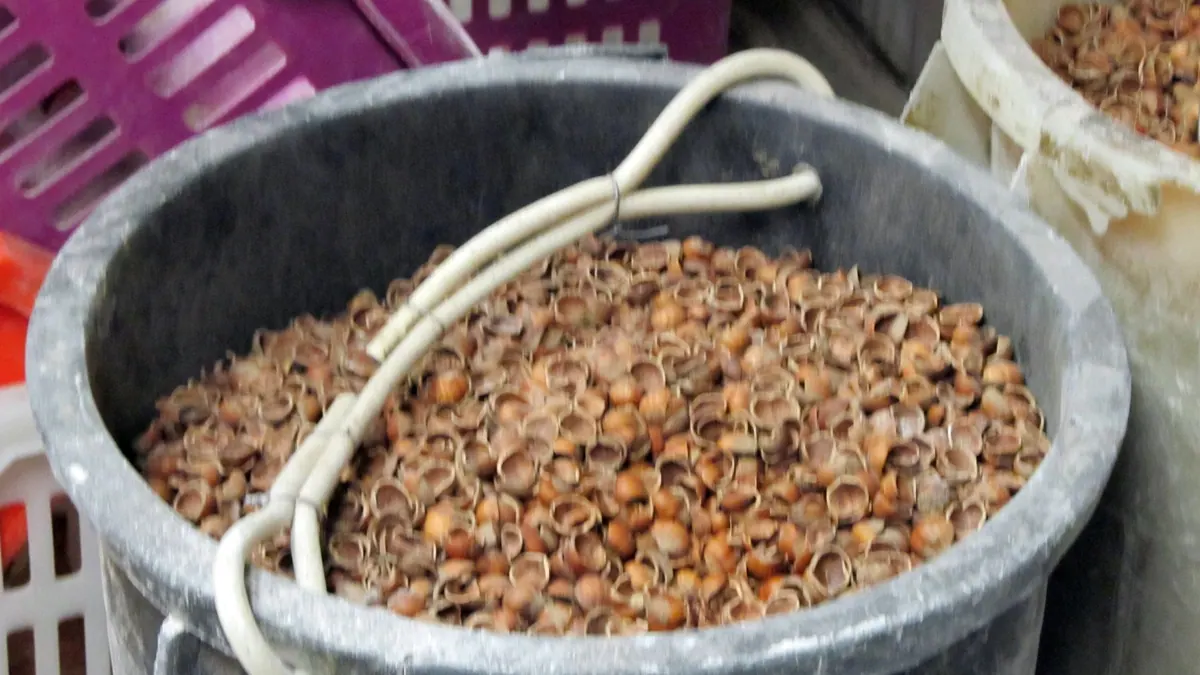
Hazelnut residues (shell, skin) — BMP: 2 studies, weighted mean 153 m³ CH₄/t VS
153 m³ CH₄/t VS weighted mean from 2 studies
neutral — editorial rating for biogas plants≈51 %
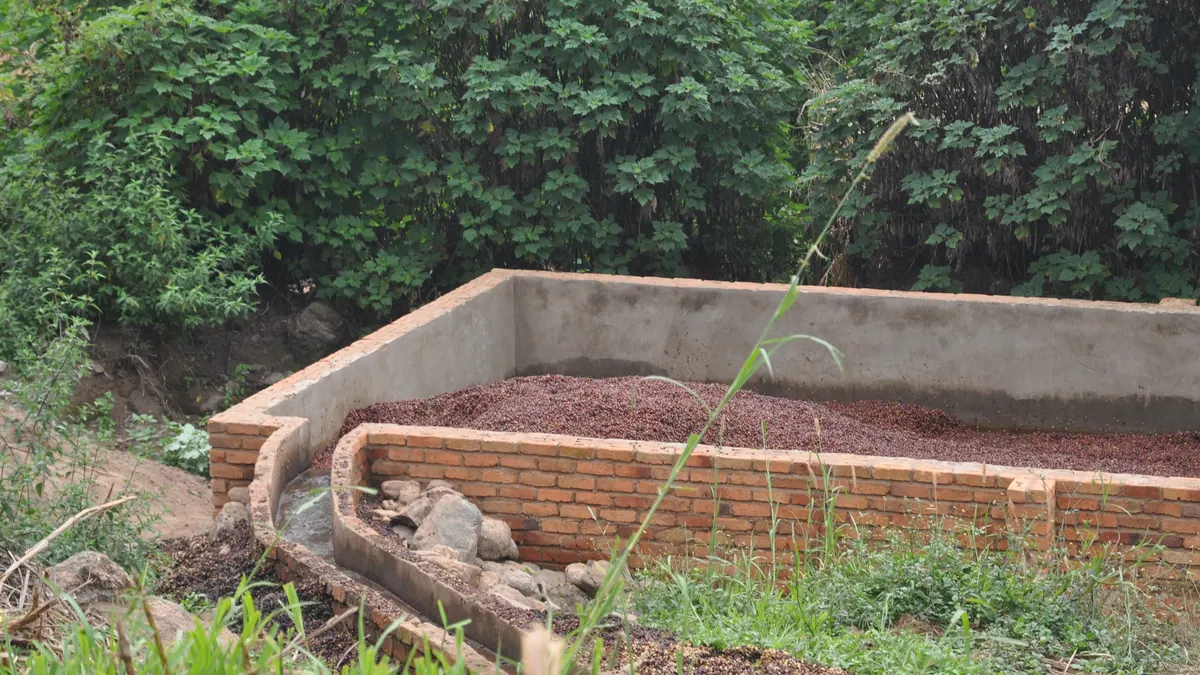
Coffee pulp — BMP: 3 studies, weighted mean 225 m³ CH₄/t VS
225 m³ CH₄/t VS weighted mean from 3 studies
≈52 %
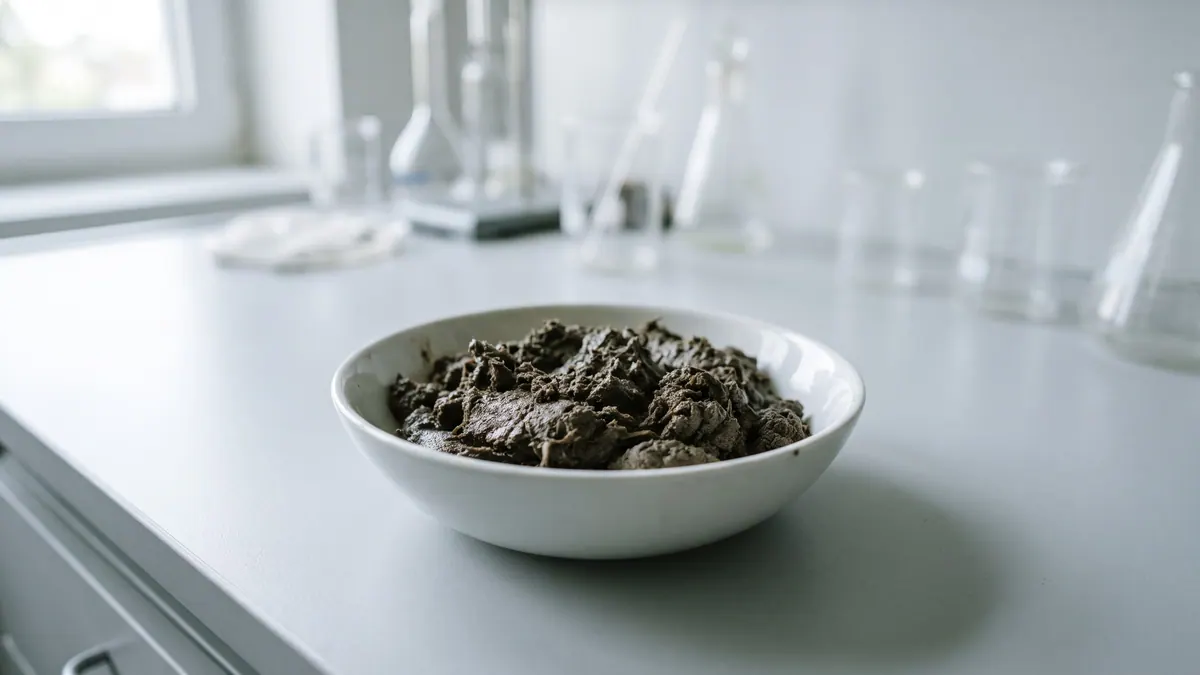
Sugarcane filter cake / press mud — BMP: 4 studies, weighted mean 190 m³ CH₄/t VS
190 m³ CH₄/t VS weighted mean from 4 studies
≈54 %
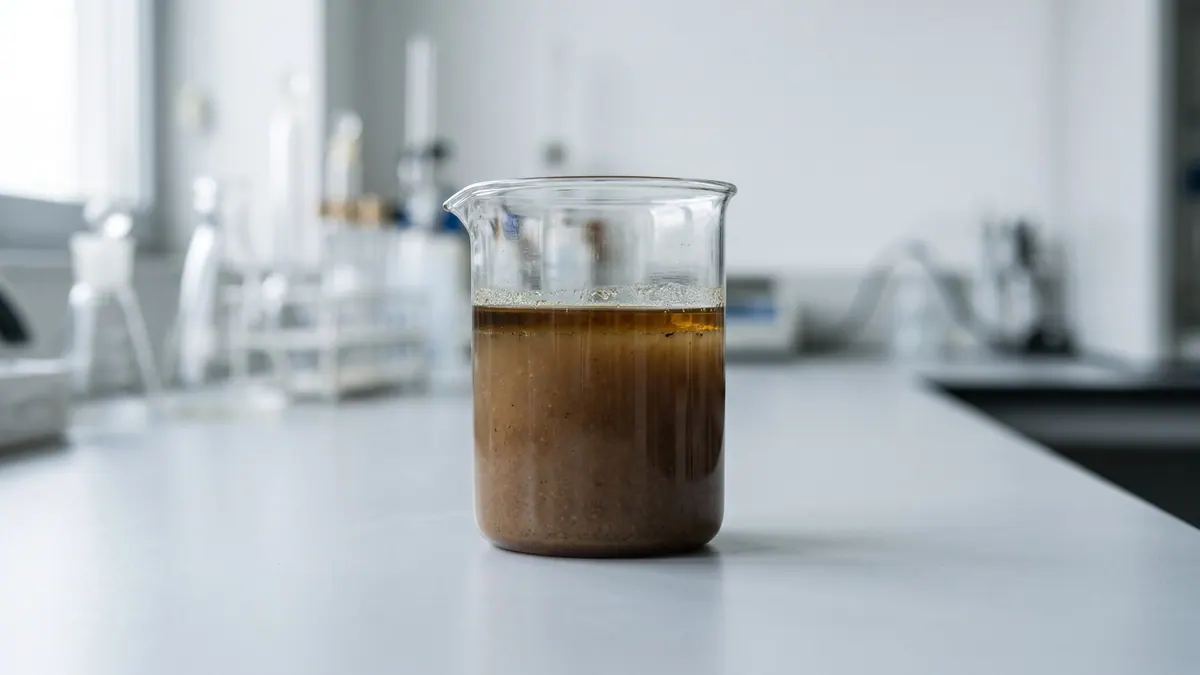
Palm oil mill effluent (POME) — BMP: 2 studies, weighted mean 431 m³ CH₄/t VS
431 m³ CH₄/t VS weighted mean from 2 studies
≈63 %