

BMP testingBy-products of the agri-food industrysingle study (3 samples)
Coffee pulp — BMP: 3 studies, weighted mean 225 m³ CH₄/t VS
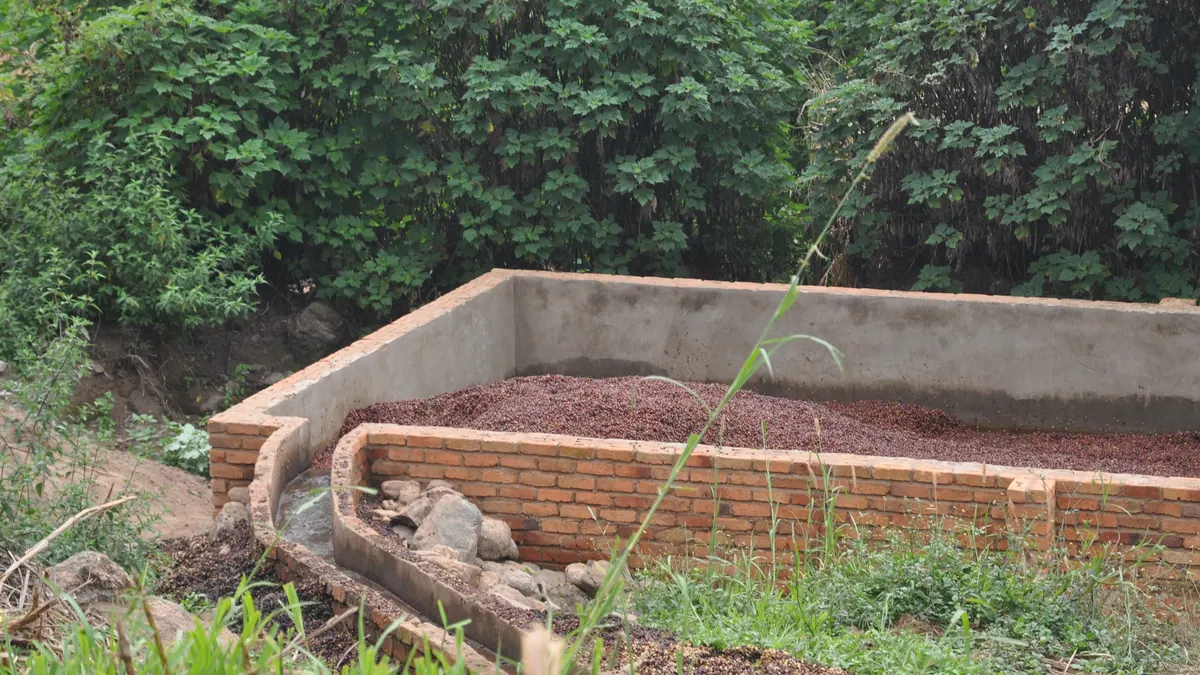
Coffee pulp is a wet waste from the wet processing of coffee, rich in sugars, pectins and polyphenols; in the dataset it was examined at several digestion temperatures.
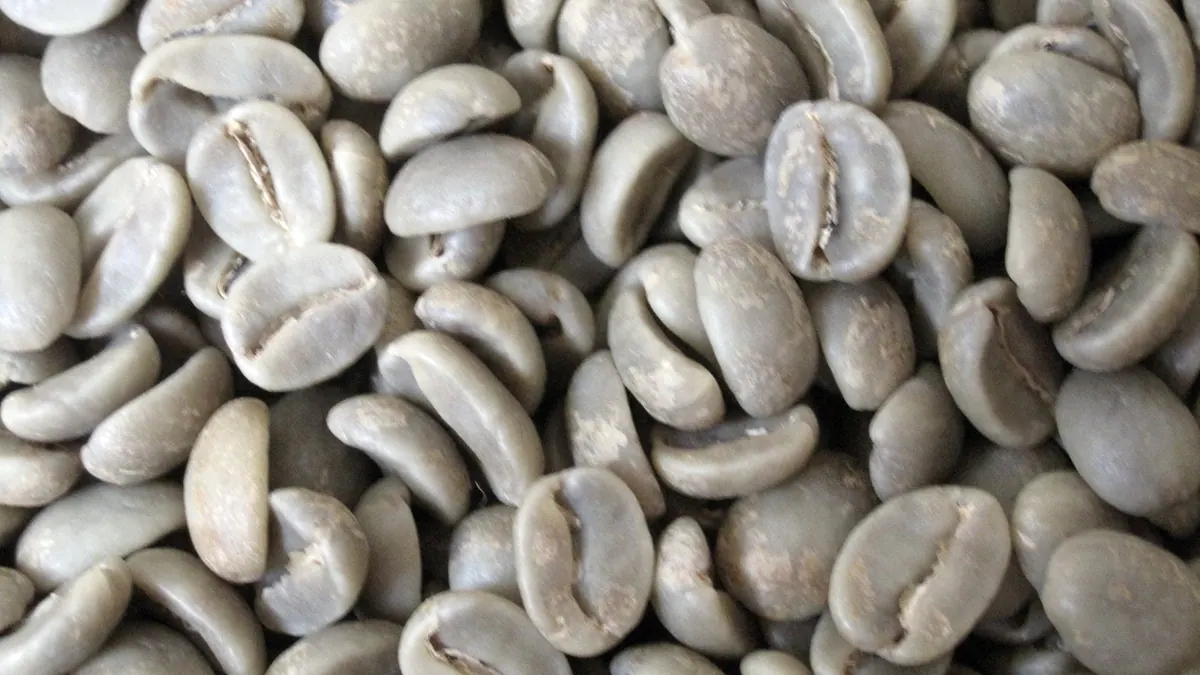
Photo Ludger001 / Wikimedia Commons, licence CC BY-SA 4.0, source file; changes: cropping

- Weighted mean
- 225m³ CH₄/t VS
- Range
- 196–245m³ CH₄/t VS
- Records
- 3single study (3 samples)
- Publications
- 1source
- Temperatures
- 21 °C, 30 °C, 37 °Cof the test
Methane in biogas
Medium methane content · ≈ 5.2 kWh/m³ of biogas
estimate from the substrate type The collected studies contain no measurement. The interval follows from the approximate composition (carbohydrate-dominated (no protein or fat characteristics)) and the yields of compound groups according to FNR.
Rating for biogas plants
not rated — editorial rating for biogas plants
Not rated: no dry matter or volatile solids in the data. We calculate the rating when the dry matter and volatile solids of the material are known.
Add to the co-digestion calculator CSV data
BMP curves from 3 studies
Weighted mean Individual records
Dashed lines are a model curve (first-order kinetics, B(t) = B₀·(1 − e−kt)); the end point comes from the publication. All curves are model curves.
Cumulative methane production over the test [m³ CH₄/t VS]. The thick line is the weighted mean of all records (225); dots mark the end values given in the publications. Point at the chart to read values; click a legend item to hide or show a record.
Records and sources
Download CSV| Source | BMP m³ CH₄/t VS | Temperature | Sample | Curve |
|---|---|---|---|---|
| Chala et al. (2019) · 1 DOI | 196 | 21 °C · psychrophilic | Coffee pulp, 21 C | end point (model curve) |
| Chala et al. (2019) · 2 DOI | 235 | 30 °C · mesophilic | Coffee pulp, 30 C | end point (model curve) |
| Chala et al. (2019) · 3 DOI | 245 | 37 °C · mesophilic | Coffee pulp, 37 C | end point (model curve) |
| Weighted mean | 225 | arithmetic mean 225, SD 26 | ||
Process properties
Low confidence: the description is based on general characteristics of the substrate group, not on studies of this material. Treat it as a hint to be verified.
Advantages
- Methane potential in the Substraty.pl BMP dataset: weighted mean 225.2 m³ CH₄/t VS (SD 25.6; 3 records, 1 source).
- Sugars and pectins give a quick start to digestion (Hagos et al. 2017).
Drawbacks and risks
- Polyphenols and caffeine may inhibit at a high share (Chen et al. 2008).
- Ferments spontaneously and quickly, acidification possible.
Co-digestion — what to combine it with, what to watch out for
- combines well
substrates: high alkalinity (buffer) — e.g. Cattle manure, Pig slurry, Cattle slurry, Duck slurry, Rumen and digestive tract content
Slurry supplies N and alkalinity, balancing the high C/N of the material.[1][2]
Dosing
No source-based threshold; start with a low share in a mix with slurry.
Introduce gradually, starting with a small dose and monitoring the process (e.g. FOS/TAC, pH, gas composition).
Sources of the process data
- Hagos et al. (2017). Anaerobic co-digestion process for biogas production: progress, challenges and perspectives. Renew. Sustain. Energy Rev.
- Weiland (2010). Biogas production: current state and perspectives. Appl. Microbiol. Biotechnol.
- Chen, Cheng, Creamer (2008). Inhibition of anaerobic digestion process: A review. Bioresour. Technol.
The co-digestion calculator will assess a specific mixture containing this substrate.
What it is and where it comes from
Coffee pulp is the outer layer of the coffee cherry, removed during the wet processing of the beans, that is, depulping. It is the largest waste stream in such processing, alongside mucilage and husk. It occurs in coffee-producing countries such as Brazil, Colombia, Ethiopia and Vietnam. There is no production in Poland, so the data are of comparative significance.
Properties relevant to digestion
The pulp is wet and contains sugars, pectins, protein and fibre, as well as caffeine, tannins and polyphenols. The latter can inhibit the activity of microorganisms if the share of pulp in the feed is high, and are often cited as a factor limiting digestion. Rapid hydrolysis of sugars can cause acidification, and the pulp easily undergoes spontaneous fermentation. The material is seasonal, linked to the coffee harvest period.
How to read the spread of results
The dataset contains several records from a single study, carried out at three temperatures: 21, 30 and 37 °C. This makes the effect of temperature within a single project visible, but the lack of an independent source makes it impossible to assess variability between laboratories. The result also depends on the ripeness of the fruit, the coffee variety (arabica, robusta), the freshness of the pulp, comminution and the inoculum.
In biogas plant practice
On coffee farms the pulp can be used in simple biogas plants with manure, usually at a small share. Dilution and gradual dosing are recommended. Storage is limited, because the material spoils quickly. The residue after digestion can be used as fertiliser, which increases the value of the system. For installations in Poland it has no practical significance.
On farms that combine coffee growing with livestock keeping, the pulp is also sometimes used as feed or compost, so its use in a biogas plant is decided by competing uses and the cost of transporting very wet mass to the installation.
For comparison with European substrates, coffee pulp is worth treating as a watery fruit waste with an admixture of polyphenols and caffeine. As with mucilage and husk, the same fruit yields three different waste fractions, which have different properties and should be assessed separately.
In addition, it is worth noting that, because of the seasonality of coffee harvests, an installation based on pulp would have to run on other feedstocks outside the season, which makes steady digester operation difficult.
Methodology in brief
BMP is the amount of methane obtained from volatile solids (VS) in a batch test, given in m³ CH₄ per tonne of VS (numerically the same as NmL CH₄/g VS in the publications) and converted to normal conditions (0 °C, 101.325 kPa). The weighted mean gives each publication a total weight of 1, split equally between its results for the substrate — a paper testing twenty varieties does not outweigh a paper with a single sample. In inter-laboratory programmes the unit is the laboratory (total weight 1), and within it the weight of a test grows with the number of bottles (replicates). Results after pretreatment (e.g. thermal, chemical, enzymatic) are shown separately and are not included in the mean.
Solid lines are curves measured in the tests. Where a publication gives only the final result, we draw a first-order kinetic model, B(t) = B₀·(1 − e−kt): only the end point comes from the publication, and the shape of the curve serves purely as visualisation — do not read the production on a particular day from it. For this substrate k = 0.091 d−1 was assumed (no kinetic data for the group – the median of all available rate constants k (93 values) was used).
The statistics describe the spread of published results — a descriptive compilation, not a meta-analysis or a guarantee of plant yield.
Bibliography
- Chala, B.; Oechsner, H.; Müller, J. (2019). Introducing Temperature as Variable Parameter into Kinetic Models for Anaerobic Fermentation of Coffee Husk, Pulp and Mucilage. Applied Sciences 9(3), 412. DOI: 10.3390/app9030412 DOI
All sources of the site: bibliography.
Other substrates in the group “By-products of the agri-food industry”
Soapstock — BMP: 3 studies, weighted mean 516 m³ CH₄/t VS
516 m³ CH₄/t VS weighted mean from 3 studies
≈63 %
Grape seeds — BMP: 2 studies, weighted mean 214 m³ CH₄/t VS
214 m³ CH₄/t VS weighted mean from 2 studies
≈52 %
Sunflower oil cake and meal — BMP: 7 studies, weighted mean 184 m³ CH₄/t VS
184 m³ CH₄/t VS weighted mean from 7 studies
neutral — editorial rating for biogas plants≈64 %
Green coffee processing residues — BMP: 2 studies, weighted mean 138 m³ CH₄/t VS
138 m³ CH₄/t VS weighted mean from 2 studies
neutral — editorial rating for biogas plants≈52 %