

BMP testingMunicipal and green waste, paper and textiles
Cotton textiles (incl. denim) — BMP: 7 studies, weighted mean 239 m³ CH₄/t VS
Cotton textiles (cotton, denim) are almost pure cellulose of high crystallinity; degradation in the digester is slow, and dyes and admixtures change the result.
rating: neutralCH₄ ≈ 51 % (estimate)
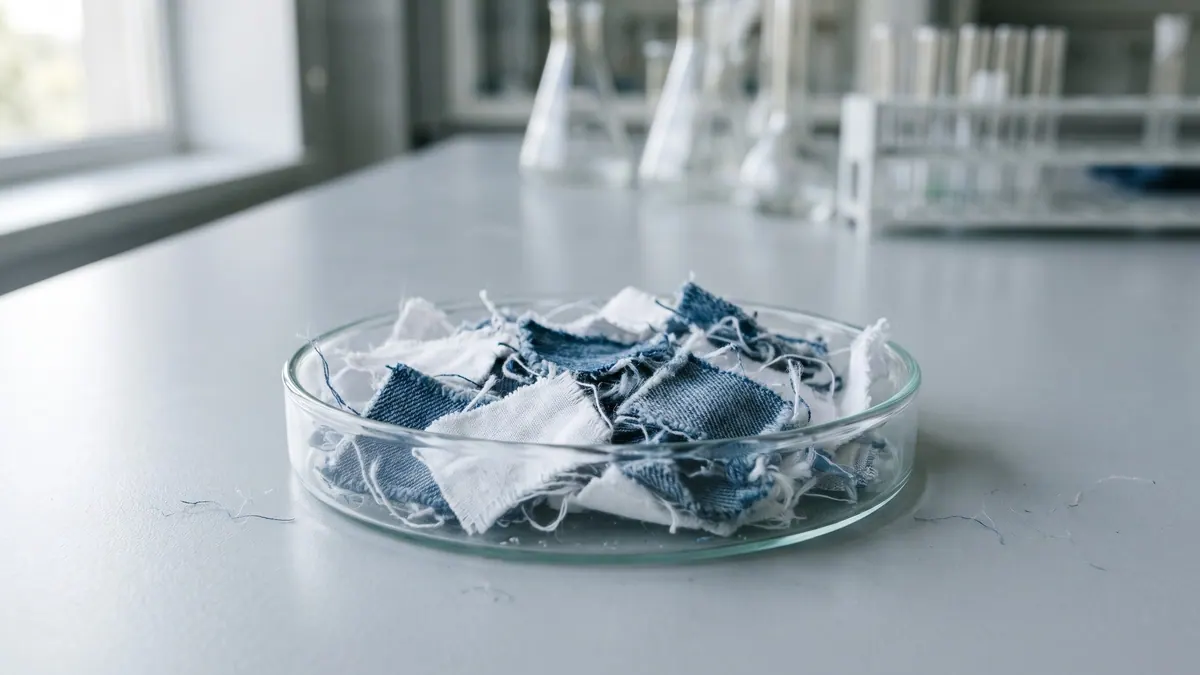
Illustration: FeedstockData (AI, Google Gemini)
- Weighted mean
- 239m³ CH₄/t VS
- Range
- 110–343m³ CH₄/t VS
- Records
- 7studies
- Publications
- 2sources
- Temperatures
- 35 °C, 55 °Cof the test
Methane in biogas
Low methane content · ≈ 5.1 kWh/m³ of biogas
estimate from the substrate type The collected studies contain no measurement. The interval follows from the approximate composition (protein from total nitrogen (N 0.4 % DM × 6.25)) and the yields of compound groups according to FNR.
Rating for biogas plants
neutral — editorial rating for biogas plantsNo clear advantages — worth charging a fee for accepting it
Potential per tonne of fresh matter: very high (227 m³ CH₄/t); process risk: inhibitors. Handling costs: physical contaminants (packaging, plastics), fibres, floating layer, slow degradation.
Why? Rating factors
Potential per tonne +3
- +3potential 227 m³ CH₄/t fresh matter (BMP 239 × DM 95.6 % × VS 99.2 %)
Process stability −1
- −1inhibitors: natural or residues (e.g. limonene, polyphenols, antibiotics, metals)
Handling and costs −2
- −1physical contaminants (packaging, plastics) — depackaging and separation
- −0.5fibres, floating layer — shredding and intensive mixing
- −0.5slow degradation — long retention time
Total points: 0 · thresholds: ≥ 2.5 very good, ≥ 1 good, below — neutral; negative with cumulative process risk.
Add to the co-digestion calculator CSV data
BMP curves from 7 studies
Weighted mean Individual records
Dashed lines are a model curve (first-order kinetics, B(t) = B₀·(1 − e−kt)); the end point comes from the publication. All curves are model curves.
Cumulative methane production over the test [m³ CH₄/t VS]. The thick line is the weighted mean of all records (239); dots mark the end values given in the publications. Point at the chart to read values; click a legend item to hide or show a record.
Records and sources
Download CSV| Source | BMP m³ CH₄/t VS | Temperature | Sample | Curve |
|---|---|---|---|---|
| Jin et al. (2022) · 1 DOI | 266 | — | White denim () | end point (model curve) |
| Jin et al. (2022) · 2 DOI | 327 | — | Blue denim () | end point (model curve) |
| Jin et al. (2022) · 3 DOI | 343 | — | Cotton (Gossypium herbaceum) | end point (model curve) |
| Krause et al. (2018) · 1 DOI | 110 | 35 °C · mesophilic | cotton | end point (model curve) |
| Krause et al. (2018) · 2 DOI | 156 | 55 °C · thermophilic | cotton | end point (model curve) |
| Krause et al. (2018) · 3 DOI | 180 | 35 °C · mesophilic | cotton | end point (model curve) |
| Krause et al. (2018) · 4 DOI | 220 | 55 °C · thermophilic | cotton | end point (model curve) |
| Weighted mean | 239 | arithmetic mean 229, SD 88 | ||
Typical composition
- Dry matter (DM)
- 95.6% (range 95.6–95.6)
- Volatile solids (VS)
- 99.2 % DM (range 99–99.5)
- Nitrogen
- 0.4 % DM
- C/N ratio
- 99.1
Median and range of the determinations reported in the publications behind this substrate's BMP records (read from: BCBPD, MY-D); dry matter: 1 determination, volatile solids: 4 determinations. C/N was calculated as the ratio of C and N content (% DM) from the same source. Samples were tested dried/air-dry – the DM refers to the material in the test, not to fresh material.
Sources: Jin et al. (2022); Krause et al. (2018).
The composition of the raw material varies between batches — for plant calculations use an analysis of your own sample. The calculator inserts typical values automatically.
Process properties
Low confidence: the description is based on general characteristics of the substrate group, not on studies of this material. Treat it as a hint to be verified.
Advantages
- Methane potential in the Substraty.pl BMP dataset: weighted mean 239.2 m³ CH₄/t VS (SD 87.5; 7 records, 2 sources).
- Cotton cellulose; after separating the cellulose from the polyester and pretreatment, biogas was obtained from the regenerated cellulose (Jeihanipour et al. 2010).
Drawbacks and risks
- Polyester and elastane do not degrade; dyes and finishes may inhibit.
Co-digestion — what to combine it with, what to watch out for
- combines well
substrates: high alkalinity (buffer) — e.g. Cattle manure, Pig slurry, Cattle slurry, Duck slurry, Rumen and digestive tract content
Dosing
No source-based threshold; shredded, low share.
Introduce gradually, starting with a small dose and monitoring the process (e.g. FOS/TAC, pH, gas composition).
Practical requirements
- Shred: shredding increases the surface available for degradation and speeds it up, but does not necessarily raise the final gas yield (FNR 2010, Ch. 3 “Triturado”).
Sources of the process data
- Hagos et al. (2017). Anaerobic co-digestion process for biogas production: progress, challenges and perspectives. Renew. Sustain. Energy Rev.
- Weiland, P. (2010) Biogas production: current state and perspectives. Applied Microbiology and Biotechnology
- Jeihanipour et al. (2010). A novel process for ethanol or biogas production from cellulose in blended-fibers waste textiles. Waste Manag.
- Hendriks, Zeeman (2009). Pretreatments to enhance the digestibility of lignocellulosic biomass. Bioresour. Technol.
- Chen, Cheng, Creamer (2008). Inhibition of anaerobic digestion process: A review. Bioresour. Technol.
- FNR (2010). Guía sobre el Biogás – Desde la producción hasta el uso (hiszp. wydanie „Leitfaden Biogas”, GIZ 2013)
The co-digestion calculator will assess a specific mixture containing this substrate.
What it is and where it comes from
Cotton textiles are wastes from clothing, fabrics and the textile industry: pure cotton and denim-type fabrics. Cotton fibres consist almost entirely of cellulose. In the EU, separate collection of textiles has applied since 2025, so the stream of textile waste is growing, and the choice between reuse, recycling and energy recovery is the subject of discussion. The dataset contains cotton, white and blue denim and cotton samples tested at mesophilic and thermophilic temperature.
Properties relevant to digestion
Cotton cellulose is highly crystalline and ordered, so enzymatic hydrolysis is slow, despite the absence of lignin. The material is poor in nitrogen and phosphorus, so it needs supplementation in the mix. Clothing contains admixtures of synthetic fibres (polyester, elastane), which do not degrade, and also dyes, finishes and chemical treatments. Indigo-dyed denim may contribute compounds that act inhibitorily in large doses, although the data are limited. Fabrics require chopping, because in pieces they form compact layers.
How to read the spread of results
The spread results from the type of material (pure cotton or dyed fabric), the degree of chopping, the share of synthetic fibres and finishes, and from the test conditions: temperature, inoculum and length. Slowly degrading cellulose requires a long incubation, so short tests underestimate the result. The way the sample was prepared (cutting, milling) also matters. The several records from several sources cover different materials, so this is not a single repeatable measurement.
In biogas plant practice
Cotton textiles are not a typical biogas plant feedstock. If they are considered, it is after thorough chopping and in a small share, with supplementation of nutrients. Synthetic fibres and undegraded fragments will end up in the digestate, so the material is suitable only for single-fibre streams. Textile waste is waste (group 04 or 20), and its acceptance requires the plant's permit. The waste hierarchy provides first for reuse and recycling.
For comparison with paper, textiles have an even more ordered fibre structure, which explains the slow degradation. Pretreatment, such as milling or the action of cellulolytic enzymes, is studied in scientific papers, but is not standard at biogas plants.
Methodology in brief
BMP is the amount of methane obtained from volatile solids (VS) in a batch test, given in m³ CH₄ per tonne of VS (numerically the same as NmL CH₄/g VS in the publications) and converted to normal conditions (0 °C, 101.325 kPa). The weighted mean gives each publication a total weight of 1, split equally between its results for the substrate — a paper testing twenty varieties does not outweigh a paper with a single sample. In inter-laboratory programmes the unit is the laboratory (total weight 1), and within it the weight of a test grows with the number of bottles (replicates). Results after pretreatment (e.g. thermal, chemical, enzymatic) are shown separately and are not included in the mean.
Solid lines are curves measured in the tests. Where a publication gives only the final result, we draw a first-order kinetic model, B(t) = B₀·(1 − e−kt): only the end point comes from the publication, and the shape of the curve serves purely as visualisation — do not read the production on a particular day from it. For this substrate k = 0.110 d−1 was assumed (median of rate constants k reported in the sources and/or fitted to the mean measured curves).
The statistics describe the spread of published results — a descriptive compilation, not a meta-analysis or a guarantee of plant yield.
Bibliography
- Jin, W.; Dai, Z.; Wang, L.; Cai, F.; Song, C.; Liu, G.; Chen, C. (2022). Recycling different textile wastes for methane production: Morphological and microstructural changes and microbial community dynamics. Waste Management 151, 154–162. DOI: 10.1016/j.wasman.2022.07.018 DOI
- Krause, M.J.; Chickering, G.W.; Townsend, T.G.; Pullammanappallil, P. (2018). Effects of temperature and particle size on the biochemical methane potential of municipal solid waste components. Waste Management 71, 25–30. DOI: 10.1016/j.wasman.2017.11.015 DOI
All sources of the site: bibliography.
Other substrates in the group “Municipal and green waste, paper and textiles”
Mixed paper waste (corrugated board + tissue) — BMP: 5 studies, weighted mean 301 m³ CH₄/t VS
301 m³ CH₄/t VS weighted mean from 5 studies
≈52 %

Magazine paper — BMP: 6 studies, weighted mean 243 m³ CH₄/t VS
243 m³ CH₄/t VS weighted mean from 6 studies
good — editorial rating for biogas plants≈51 %

Office paper — BMP: 9 studies, weighted mean 314 m³ CH₄/t VS
314 m³ CH₄/t VS weighted mean from 9 studies
good — editorial rating for biogas plants≈51 %
Flower wastes (cut flowers, flower pomace) — BMP: 2 studies, weighted mean 322 m³ CH₄/t VS
322 m³ CH₄/t VS weighted mean from 2 studies
good — editorial rating for biogas plants≈54 %