

BMP testingFruit, vegetables and their residues
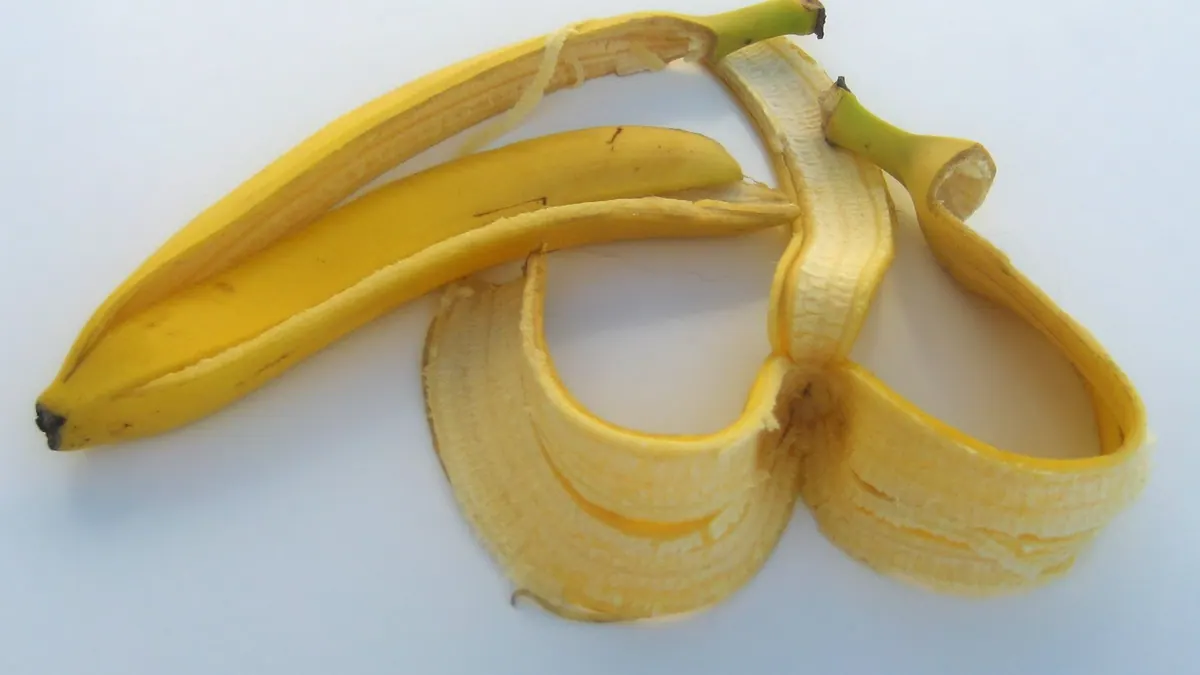
Banana peels — BMP: 17 studies, weighted mean 330 m³ CH₄/t VS
Banana peels are a common fruit waste in tropical countries, rich in fibre and potassium; results from many trials are fairly consistent, but depend on ripeness and chopping.
rating: goodCH₄ ≈ 52 % (estimate)
Photo Priwo / Wikimedia Commons, public domain, source file; changes: cropping

- Weighted mean
- 330m³ CH₄/t VS
- Range
- 243–409m³ CH₄/t VS
- Records
- 17studies
- Publications
- 5sources
- Temperatures
- 35 °C, 37 °C, 38 °Cof the test
Methane in biogas
Medium methane content · ≈ 5.2 kWh/m³ of biogas
estimate from the substrate type The collected studies contain no measurement. The interval follows from the approximate composition (carbohydrate-dominated (no protein or fat characteristics)) and the yields of compound groups according to FNR.
Rating for biogas plants
good — editorial rating for biogas plantsStable, usually accepted without a fee
Potential per tonne of fresh matter: high (55 m³ CH₄/t); no particular threats to stability. Handling costs: fibres, floating layer, slow degradation.
Why? Rating factors
Potential per tonne +2
- +2potential 55 m³ CH₄/t fresh matter (BMP 330 × DM 18.3 % × VS 91.4 %)
Process stability 0
- 0no factors
Handling and costs −1
- −0.5fibres, floating layer — shredding and intensive mixing
- −0.5slow degradation — long retention time
Total points: 1 · thresholds: ≥ 2.5 very good, ≥ 1 good, below — neutral; negative with cumulative process risk.
Add to the co-digestion calculator CSV data
BMP curves from 17 studies
Weighted mean Individual records
Dashed lines are a model curve (first-order kinetics, B(t) = B₀·(1 − e−kt)); the end point comes from the publication. All curves are model curves.
Cumulative methane production over the test [m³ CH₄/t VS]. The thick line is the weighted mean of all records (330); dots mark the end values given in the publications. Point at the chart to read values; click a legend item to hide or show a record.
Show the remaining records in the legend (5)
Records and sources
Download CSV| Source | BMP m³ CH₄/t VS | Temperature | Sample | Curve |
|---|---|---|---|---|
| Sharma et al. (1988) · 1 DOI | 271 | 37 °C · mesophilic | Banana · pretreatment: Material were first dried in the sun and then in an oven at 90oC | end point (model curve) |
| Sharma et al. (1988) · 2 DOI | 374 | 37 °C · mesophilic | Banana · pretreatment: Material were first dried in the sun and then in an oven at 90oC | end point (model curve) |
| Sharma et al. (1988) · 3 DOI | 396 | 37 °C · mesophilic | Banana · pretreatment: Material were first dried in the sun and then in an oven at 90oC | end point (model curve) |
| Sharma et al. (1988) · 4 DOI | 408 | 37 °C · mesophilic | Banana · pretreatment: Material were first dried in the sun and then in an oven at 90oC | end point (model curve) |
| Sharma et al. (1988) · 5 DOI | 409 | 37 °C · mesophilic | Banana · pretreatment: Material were first dried in the sun and then in an oven at 90oC | end point (model curve) |
| Dubrovskis i Plume (2022) DOI | 325 | 38 °C · mesophilic | Banana peel | end point (model curve) |
| Khan M.T. (2016) | 322 | 37 °C · mesophilic | Banana peel | end point (model curve) |
| Gunaseelan (2004) · 1 DOI | 243 | 35 °C · mesophilic | Banana peels | end point (model curve) |
| Gunaseelan (2004) · 2 DOI | 274 | 35 °C · mesophilic | Banana peels | end point (model curve) |
| Gunaseelan (2004) · 3 DOI | 277 | 35 °C · mesophilic | Banana peels | end point (model curve) |
| Gunaseelan (2004) · 4 DOI | 284 | 35 °C · mesophilic | Banana peels | end point (model curve) |
| Gunaseelan (2004) · 5 DOI | 300 | 35 °C · mesophilic | Banana peels | end point (model curve) |
| Gunaseelan (2004) · 6 DOI | 314 | 35 °C · mesophilic | Banana peels | end point (model curve) |
| Gunaseelan (2004) · 7 DOI | 321 | 35 °C · mesophilic | Banana peels | end point (model curve) |
| Gunaseelan (2004) · 8 DOI | 322 | 35 °C · mesophilic | Banana peels | end point (model curve) |
| Sanjaya et al. (2016) · 1 DOI | 332 | 35 °C · mesophilic | Rooten banana peel | end point (model curve) |
| Sanjaya et al. (2016) · 2 DOI | 342 | 35 °C · mesophilic | Fresh ripe banana peel | end point (model curve) |
| Weighted mean | 330 | arithmetic mean 324, SD 49 | ||
Typical composition
- Dry matter (DM)
- 18.3% (range 10.6–22.4)
- Volatile solids (VS)
- 91.4 % DM (range 83.8–94.3)
- C/N ratio
- 55.4
Median and range of the determinations reported in the publications behind this substrate's BMP records (read from: CROPGEN D4, MY-D); dry matter: 3 determinations, volatile solids: 9 determinations.
Sources: Sharma et al. (1988); Gunaseelan (2004); Sanjaya et al. (2016).
The composition of the raw material varies between batches — for plant calculations use an analysis of your own sample. The calculator inserts typical values automatically.
Process properties
Advantages
- Methane yield in the compendium: median 322 (range 243–409) m³ CH₄/t VS, 17 records from 5 papers (weighted mean 330).
- Grinding banana peel gave a higher yield than chopping (Odedina et al. (2017))
- Two-stage digestion with thermophilic prehydrolysis (HRT 4 d) before a mesophilic reactor improved energy yield and stability at a higher solids content (Odedina et al. (2017))
Drawbacks and risks
- In a single-stage reactor (mesophilic, HRT 20 d) banana peel failed when fed at 2% DM, and stabilised after reduction to 1.5% DM (Odedina et al. (2017))
Co-digestion — what to combine it with, what to watch out for
- combines well
substrates: easily degradable — e.g. Maize silage (whole crop), Food waste, Sorghum, whole crop, Whey, Beet leaves and tops
In BMP studies, easily degradable substrates increased the yield of the mixture with slurry (synergy in some mixtures).[1]
Dosing
The sources do not give a share in the feed. Odedina et al. (2017): a single-stage mesophilic reactor (HRT 20 d) failed when fed banana peel at 2% DM, and recovered stability at 1.5% DM; a two-stage system with thermophilic prehydrolysis operated at 2% DM.
Practical requirements
- Shred: the yield depends on particle size (ground banana peels gave more than chopped ones) (Odedina et al. (2017); Sharma et al. (1988))
Sources of the process data
- Biochemical methane potential and biodegradability of complex organic substrates
- Effect of particle size on biogas generation from biomass residues
- Anaerobic fermentation of kitchen waste
- Batch anaerobic digestion of banana waste - energy potential and modelling of methane production kinetics
- Biochemical methane potential of fruits and vegetable solid waste feedstocks
- Mesophilic batch anaerobic digestion from fruit fragments
- Effects of size and thermophilic pre-hydrolysis of banana peel during anaerobic digestion, and biomethanation potential of key tropical fruit wastes
- Improvement of fruit and vegetable waste anaerobic digestion performance and stability with co-substrates addition
The co-digestion calculator will assess a specific mixture containing this substrate.
What it is and where it comes from
Banana peels (Musa spp.) are one of the largest waste streams in banana-producing countries, where they form a considerable part of the mass of the fruit. In Poland bananas are imported, and peels arise in ripening rooms, wholesalers, catering and processing (dried chips, puree). The scale is much smaller than in the tropics, but may be significant locally.
Properties relevant to digestion
The peels contain a lot of water, and the dry matter contains soluble sugars, pectins, cellulose, hemicellulose and lignin in moderate quantity, and in the peels of unripe fruit also starch. With ripening, starch is converted into sugars, which changes the rate of hydrolysis. The peels are rich in potassium, and also in polyphenols and tannins, which at typical shares are not a significant inhibitor. For digestion, the relatively low protein and lipid content is favourable, but it also means a high C/N ratio, so adding nitrogen (slurry) improves the balance. Pesticides used in banana cultivation may be present in the peels as a contaminant.
How to read the spread of results
The dataset contains several records from several sources, so it is relatively extensive. A considerable proportion of the records comes from one study in which different chopping fractions of the peels were examined. Chopping affects the rate and the final result, because finer particles are degraded faster. In addition, the results depend on the banana variety (dessert bananas or plantains), ripeness, the way the sample was prepared and the inoculum. The remaining results are mesophilic, which limits the effect of temperature.
In biogas plant practice
Banana peels are suitable for co-digestion with slurry or manure after chopping. Dosing should be gradual and pH monitored. The peels quickly darken and spoil, giving off odours, so they should not be stored for long. In Poland the material is available sporadically and usually in small quantities. Waste from trade and catering is subject to waste regulations, and its acceptance requires permits and compliance with the rules concerning kitchen waste.
For plants in Poland, banana peels are significant mainly as an example of a fruit waste rich in fibre and potassium; potassium passes into the digestate, which increases its fertiliser value, but in large quantities may affect soil salinity.
Methodology in brief
BMP is the amount of methane obtained from volatile solids (VS) in a batch test, given in m³ CH₄ per tonne of VS (numerically the same as NmL CH₄/g VS in the publications) and converted to normal conditions (0 °C, 101.325 kPa). The weighted mean gives each publication a total weight of 1, split equally between its results for the substrate — a paper testing twenty varieties does not outweigh a paper with a single sample. In inter-laboratory programmes the unit is the laboratory (total weight 1), and within it the weight of a test grows with the number of bottles (replicates). Results after pretreatment (e.g. thermal, chemical, enzymatic) are shown separately and are not included in the mean.
Solid lines are curves measured in the tests. Where a publication gives only the final result, we draw a first-order kinetic model, B(t) = B₀·(1 − e−kt): only the end point comes from the publication, and the shape of the curve serves purely as visualisation — do not read the production on a particular day from it. For this substrate k = 0.245 d−1 was assumed (median of rate constants k reported in the sources and/or fitted to the mean measured curves).
The statistics describe the spread of published results — a descriptive compilation, not a meta-analysis or a guarantee of plant yield.
Bibliography
- Sharma, S.K.; Mishra, I.; Sharma, M.; Saini, J. (1988). Effect of particle size on biogas generation from biomass residues. Biomass 17(4), 251–263. DOI: 10.1016/0144-4565(88)90107-2 DOI
- Dubrovskis, V.; Plume, I. (2022). Anaerobic fermentation of kitchen waste. Engineering for Rural Development 21. DOI: 10.22616/erdev.2022.21.tf020 DOI
- Khan M.T., Brule M., Maurer C., Argyropoulos D., Muller J., Oechsner H. (2016). Batch anaerobic digestion of banana waste - energy potential and modelling of methane production kinetics. AgricEngInt: CIGR Journal 18(1). https://cigrjournal.org/index.php/Ejounral/article/download/3244/2288 source
- Gunaseelan, V. (2004). Biochemical methane potential of fruits and vegetable solid waste feedstocks. Biomass and Bioenergy 26(4), 389–399. DOI: 10.1016/j.biombioe.2003.08.006 DOI
- Sanjaya, A.P.; Cahyanto, M.N.; Millati, R. (2016). Mesophilic batch anaerobic digestion from fruit fragments. Renewable Energy 98, 135–141. DOI: 10.1016/j.renene.2016.02.059 DOI
All sources of the site: bibliography.
Other substrates in the group “Fruit, vegetables and their residues”
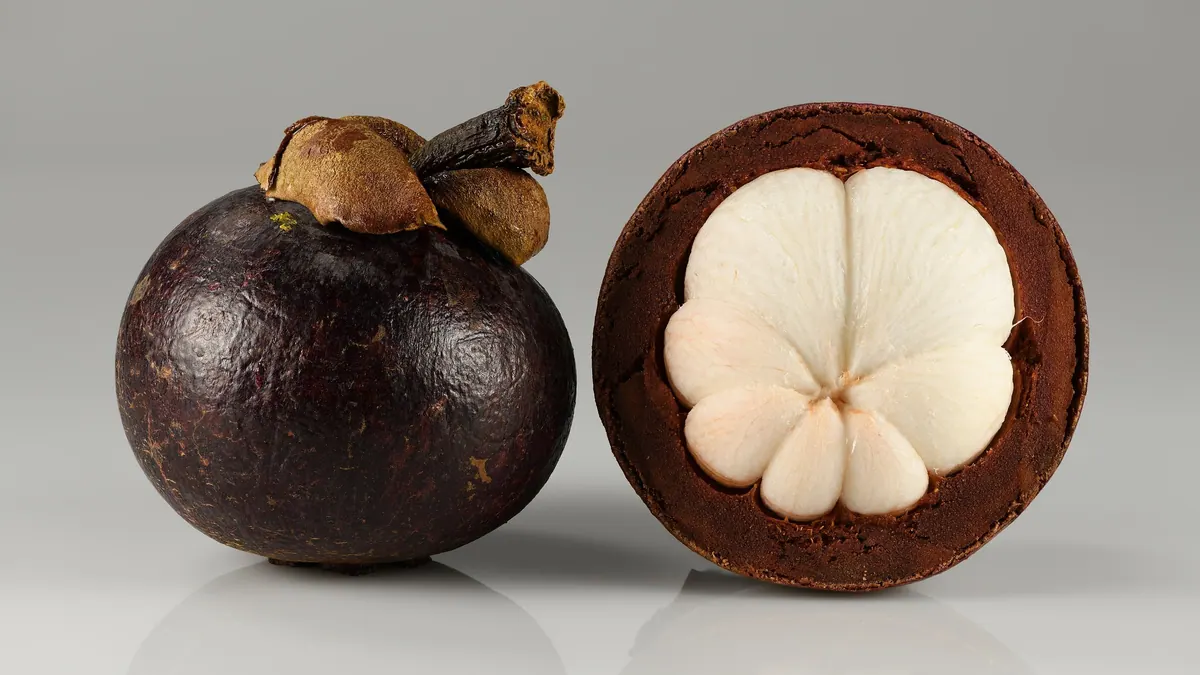
Mangosteen pulp — BMP: 2 studies, weighted mean 384 m³ CH₄/t VS
384 m³ CH₄/t VS weighted mean from 2 studies
≈52 %
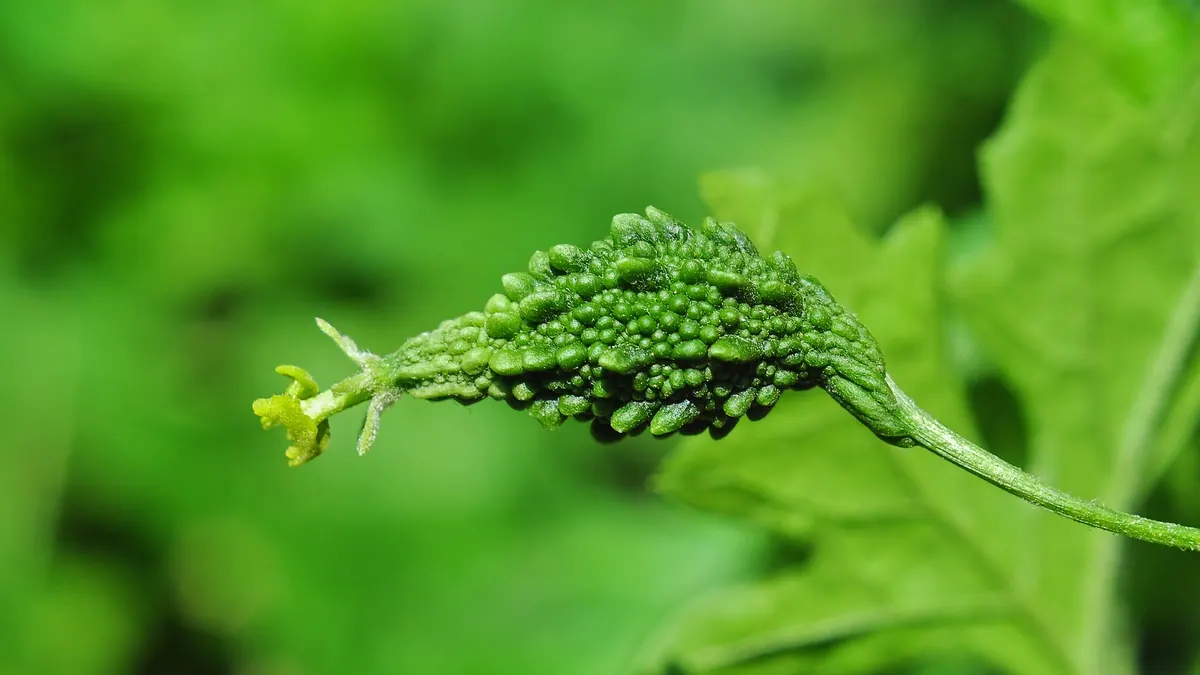
Other cucurbit vegetables (bitter melon, luffa, wax gourd, chayote, horned melon) — BMP: 5 studies, mean 274 m³ CH₄/t VS
274 m³ CH₄/t VS weighted mean from 5 studies
≈55 %
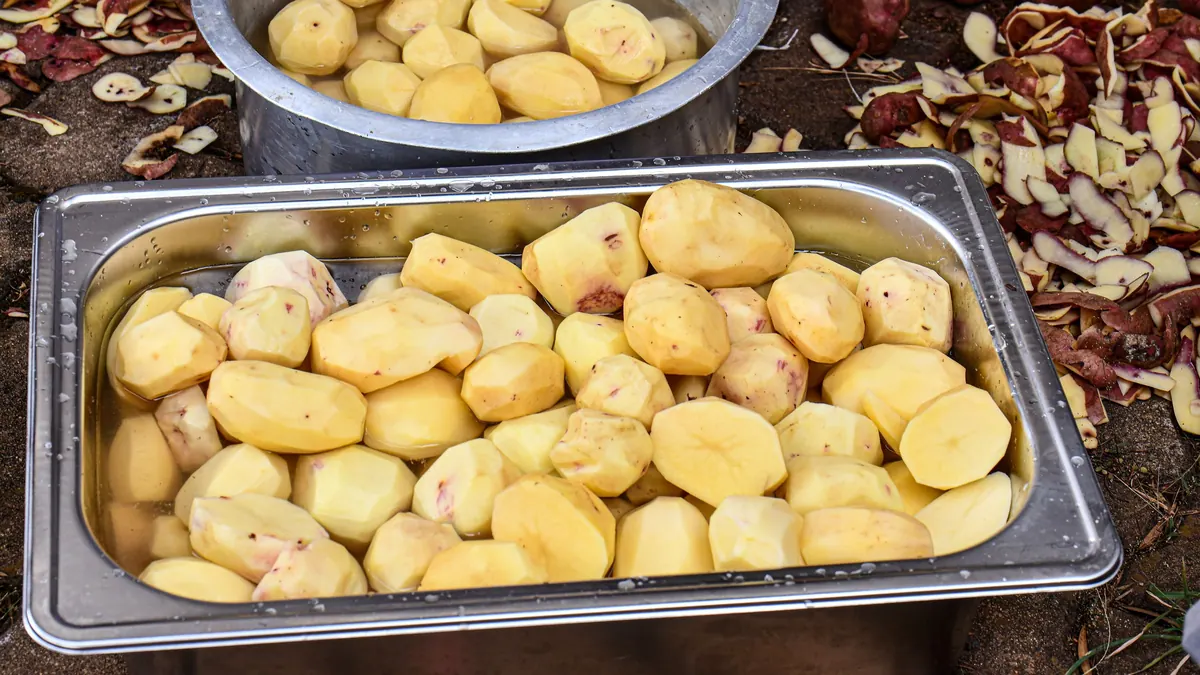
Potato peels — BMP: 5 studies, weighted mean 234 m³ CH₄/t VS
234 m³ CH₄/t VS weighted mean from 5 studies
neutral — editorial rating for biogas plants≈56 %
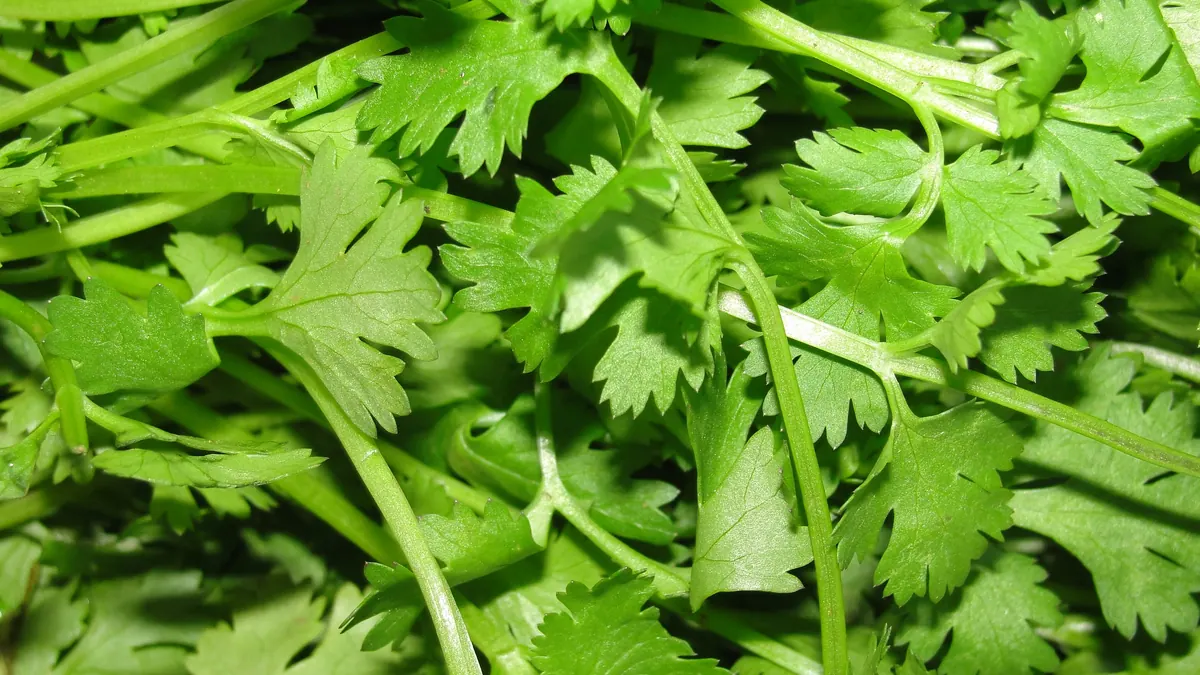
Coriander — BMP: 5 studies, weighted mean 255 m³ CH₄/t VS
255 m³ CH₄/t VS weighted mean from 5 studies
≈58 %