

BMP testingWild, invasive and medicinal plantssingle study (2 samples)
Fat hen (Chenopodium album) — BMP: 2 studies, weighted mean 216 m³ CH₄/t VS
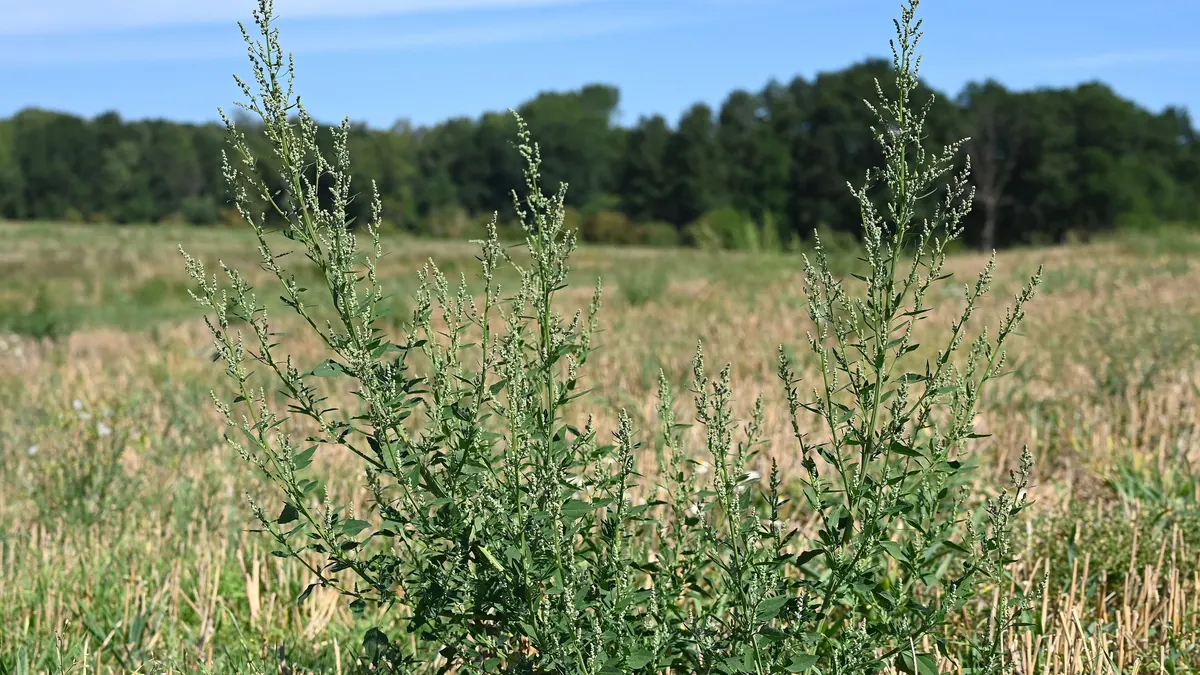
Fat hen (Chenopodium album) is a common weed; the dataset contains records from a single study, stems separately and leaves with seeds.
Photo Krzysztof Ziarnek, Kenraiz / Wikimedia Commons, licence CC BY-SA 4.0, source file; changes: cropping

- Weighted mean
- 216m³ CH₄/t VS
- Range
- 171–262m³ CH₄/t VS
- Records
- 2single study (2 samples)
- Publications
- 1source
- Temperatures
- 37 °Cof the test
Methane in biogas
Medium methane content · ≈ 5.2 kWh/m³ of biogas
estimate from the substrate type The collected studies contain no measurement. The interval follows from the approximate composition (carbohydrate-dominated (no protein or fat characteristics)) and the yields of compound groups according to FNR.
Rating for biogas plants
not rated — editorial rating for biogas plants
Not rated: the dry matter in the data refers to a sample dried for the test, not to the material as delivered. We calculate the rating when the dry matter and volatile solids of the material are known.
Add to the co-digestion calculator CSV data
BMP curves from 2 studies
Weighted mean Individual records
Dashed lines are a model curve (first-order kinetics, B(t) = B₀·(1 − e−kt)); the end point comes from the publication. All curves are model curves.
Cumulative methane production over the test [m³ CH₄/t VS]. The thick line is the weighted mean of all records (216); dots mark the end values given in the publications. Point at the chart to read values; click a legend item to hide or show a record.
Records and sources
Download CSV| Source | BMP m³ CH₄/t VS | Temperature | Sample | Curve |
|---|---|---|---|---|
| Li et al. (2013) · 1 DOI | 171 | 37 °C · mesophilic | Chenopodium album L. stalk | end point (model curve) |
| Li et al. (2013) · 2 DOI | 262 | 37 °C · mesophilic | Chenopodium album L. leaf and seed | end point (model curve) |
| Weighted mean | 216 | arithmetic mean 216, SD 64 | ||
Typical composition
- Dry matter (DM)
- 85.1% (range 84.4–85.8)
- Volatile solids (VS)
- 94.8 % DM (range 92.7–97)
Median and range of the determinations reported in the publications behind this substrate's BMP records (read from: MY-D); dry matter: 2 determinations, volatile solids: 2 determinations.
Sources: Li et al. (2013).
The composition of the raw material varies between batches — for plant calculations use an analysis of your own sample. The calculator inserts typical values automatically.
Process properties
Low confidence: the description is based on general characteristics of the substrate group, not on studies of this material. Treat it as a hint to be verified.
Advantages
- Methane potential in the database: weighted mean 216 m³ CH₄/t VS (median 216; range 171-262; 2 records from 1 source).
- The result comes from a study comparing many biomasses under identical conditions (Li 2013), which makes comparison with other plants easier.
Drawbacks and risks
- Spread of results in the database: standard deviation 64 at a mean of 216 m³ CH₄/t VS (2 records from 1 source).
Dosing
No dose data; treat as a poorly studied green forage additive, after a BMP test.
Sources of the process data
- Chen, Y.; Cheng, J.J.; Creamer, K.S. (2008) Inhibition of anaerobic digestion process: A review. Bioresource Technology
- Li, Y.; Zhang, R.; Liu, G.; Chen, C.; He, Y.; Liu, X. (2013) Comparison of methane production potential, biodegradability, and kinetics of different organic substrates. Bioresource Technology 149, 565–569
- Weiland, P. (2010) Biogas production: current state and perspectives. Applied Microbiology and Biotechnology
The co-digestion calculator will assess a specific mixture containing this substrate.
What it is and where it comes from
Fat hen (Chenopodium album) is an annual plant of the Amaranthaceae family, very common in fields, fallows and ruderal areas in Poland and worldwide. It grows quickly and can reach considerable biomass, but as a weed it is not grown for energy purposes. Harvesting weed biomass from fields is irregular. The dataset contains several records from a single study: stems and leaves with seeds.
Properties relevant to digestion
Leaves and young shoots are green, relatively rich in protein and mineral components, and the stems become woody with time and contain more lignin. The seeds have starch and fat, but are small and hard. Fat hen accumulates nitrates and oxalates, particularly on soils heavily fertilised with nitrogen. Material from mature plants is generally harder to degrade than green forage from the growing season. It is well suited to ensiling if it has a suitable dry matter content.
How to read the spread of results
The records describe different parts of the plant, so the difference is natural. They come from a single study and a single temperature, so inter-laboratory variability is unknown. The harvest date has a strong effect: a green plant before flowering has a different composition from a mature one with seeds. The habitat, soil fertilisation, size reduction and the inoculum also matter. The data illustrate the range of possibilities of weed biomass, and not a parameter for planning.
In biogas plant practice
Fat hen can be an additive to the mix if it is available in quantities resulting from mowing fallows and green areas, but it does not form a regular stream. Care should be taken over the appropriate mowing date, before the seeds are shed, so as not to spread the weed with the digestate. In the case of longer storage, ensiling must be provided. Before planned use, a BMP test on local biomass is advisable.
Methodology in brief
BMP is the amount of methane obtained from volatile solids (VS) in a batch test, given in m³ CH₄ per tonne of VS (numerically the same as NmL CH₄/g VS in the publications) and converted to normal conditions (0 °C, 101.325 kPa). The weighted mean gives each publication a total weight of 1, split equally between its results for the substrate — a paper testing twenty varieties does not outweigh a paper with a single sample. In inter-laboratory programmes the unit is the laboratory (total weight 1), and within it the weight of a test grows with the number of bottles (replicates). Results after pretreatment (e.g. thermal, chemical, enzymatic) are shown separately and are not included in the mean.
Solid lines are curves measured in the tests. Where a publication gives only the final result, we draw a first-order kinetic model, B(t) = B₀·(1 − e−kt): only the end point comes from the publication, and the shape of the curve serves purely as visualisation — do not read the production on a particular day from it. For this substrate k = 0.134 d−1 was assumed (median of rate constants k reported in the sources and/or fitted to the mean measured curves).
The statistics describe the spread of published results — a descriptive compilation, not a meta-analysis or a guarantee of plant yield.
Bibliography
- Li, Y.; Zhang, R.; Liu, G.; Chen, C.; He, Y.; Liu, X. (2013). Comparison of methane production potential, biodegradability, and kinetics of different organic substrates. Bioresource Technology 149, 565–569. DOI: 10.1016/j.biortech.2013.09.063 DOI
All sources of the site: bibliography.
Other substrates in the group “Wild, invasive and medicinal plants”
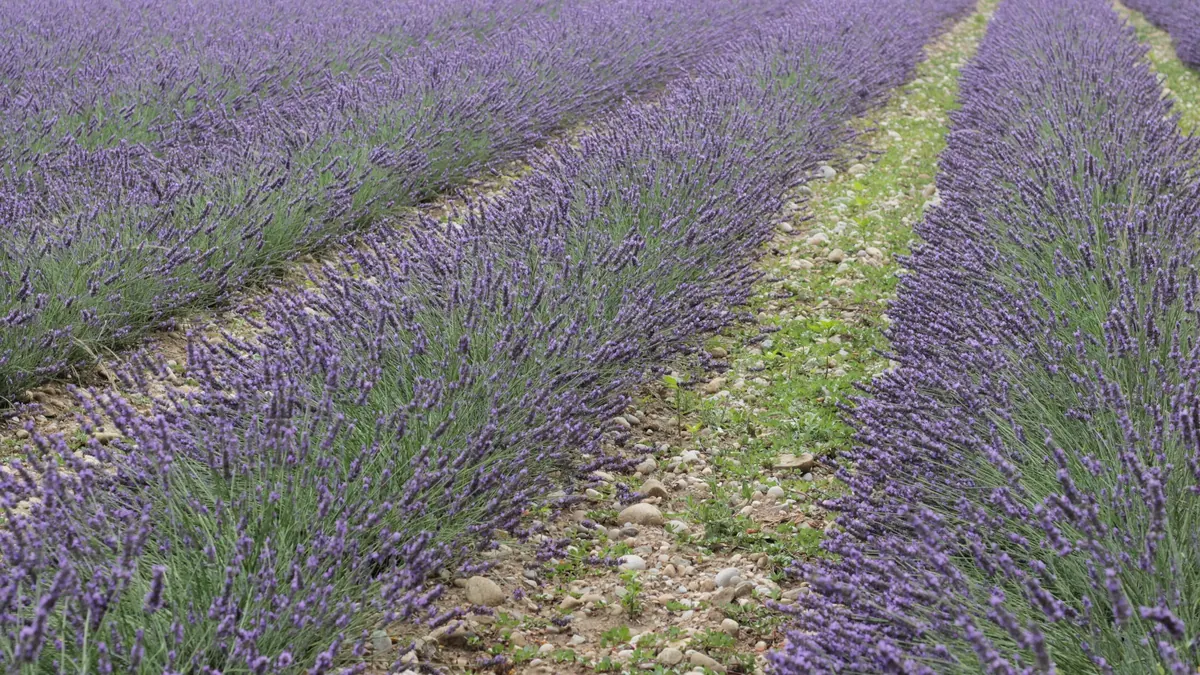
Lavender flowers and distillation residues — BMP: 2 studies, weighted mean 186 m³ CH₄/t VS
186 m³ CH₄/t VS weighted mean from 2 studies
≈52 %
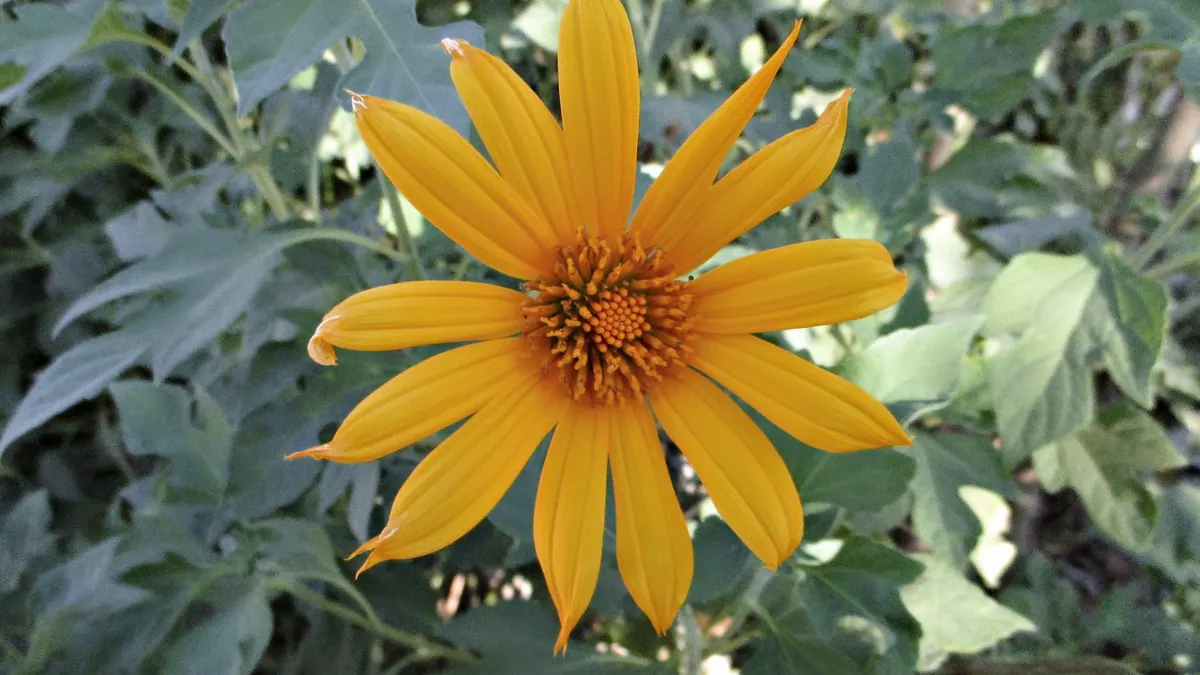
Mexican sunflower (Tithonia diversifolia) — BMP: 2 studies, weighted mean 210 m³ CH₄/t VS
210 m³ CH₄/t VS weighted mean from 2 studies
≈55 %
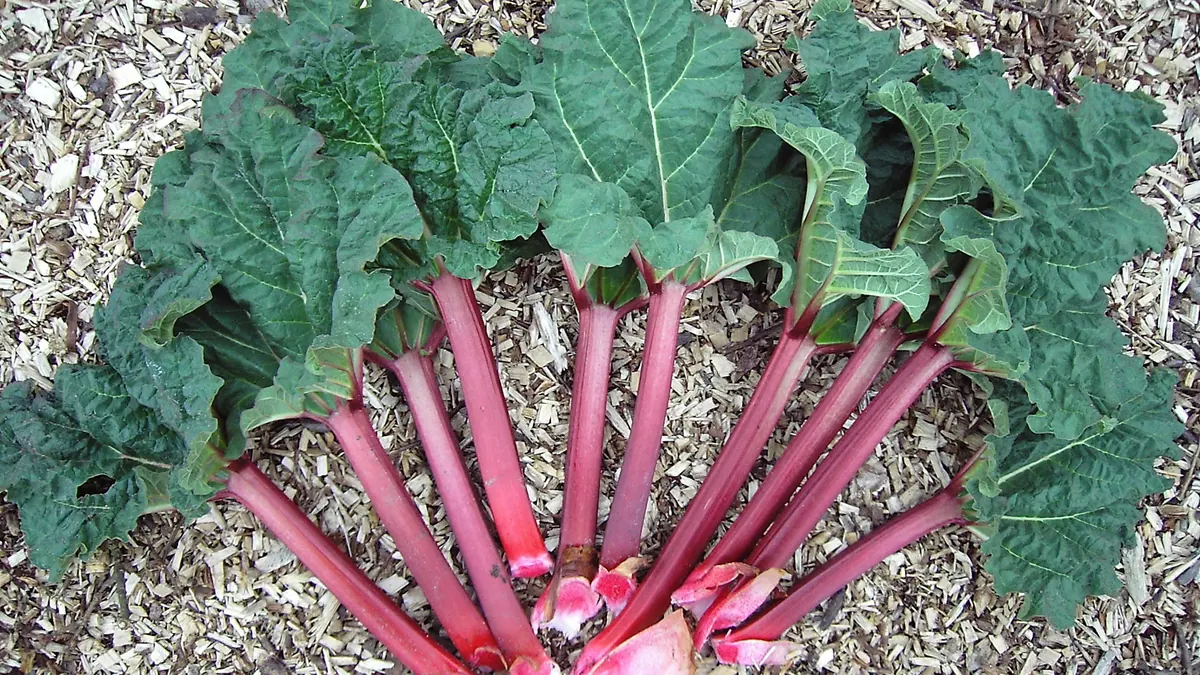
Rhubarb — BMP: 4 studies, weighted mean 368 m³ CH₄/t VS
368 m³ CH₄/t VS weighted mean from 4 studies
neutral — editorial rating for biogas plants67 %
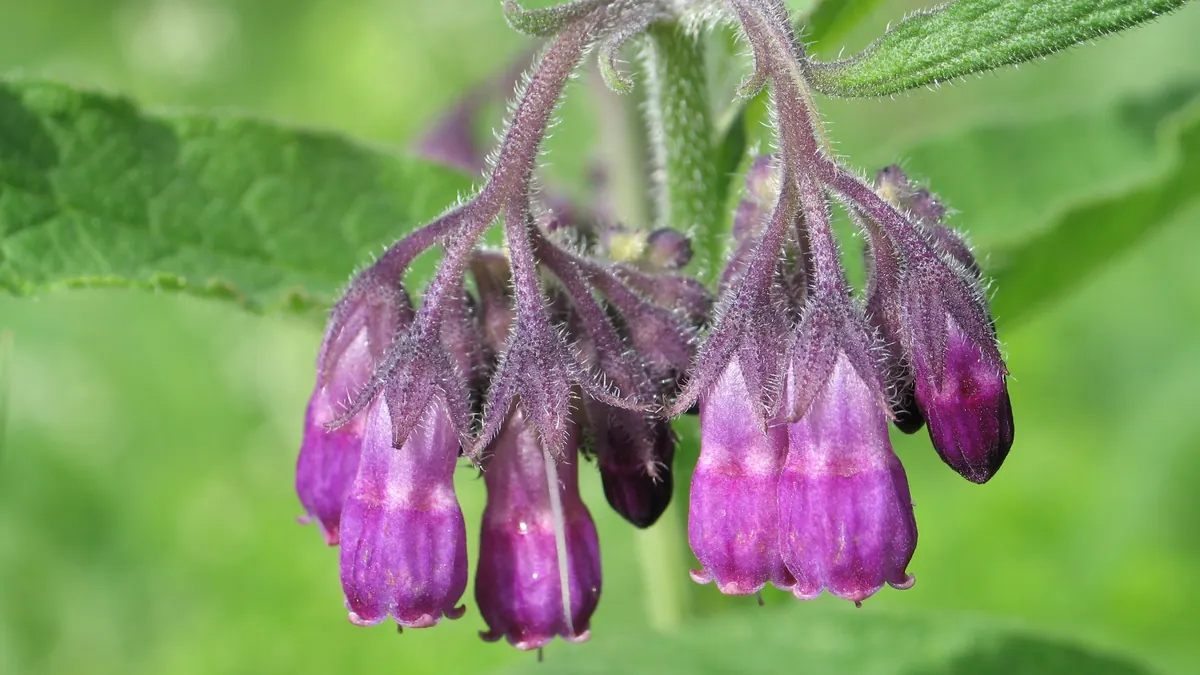
Comfrey — BMP: 2 studies, weighted mean 328 m³ CH₄/t VS
328 m³ CH₄/t VS weighted mean from 2 studies
good — editorial rating for biogas plants70 %