

BMP testingWild, invasive and medicinal plants
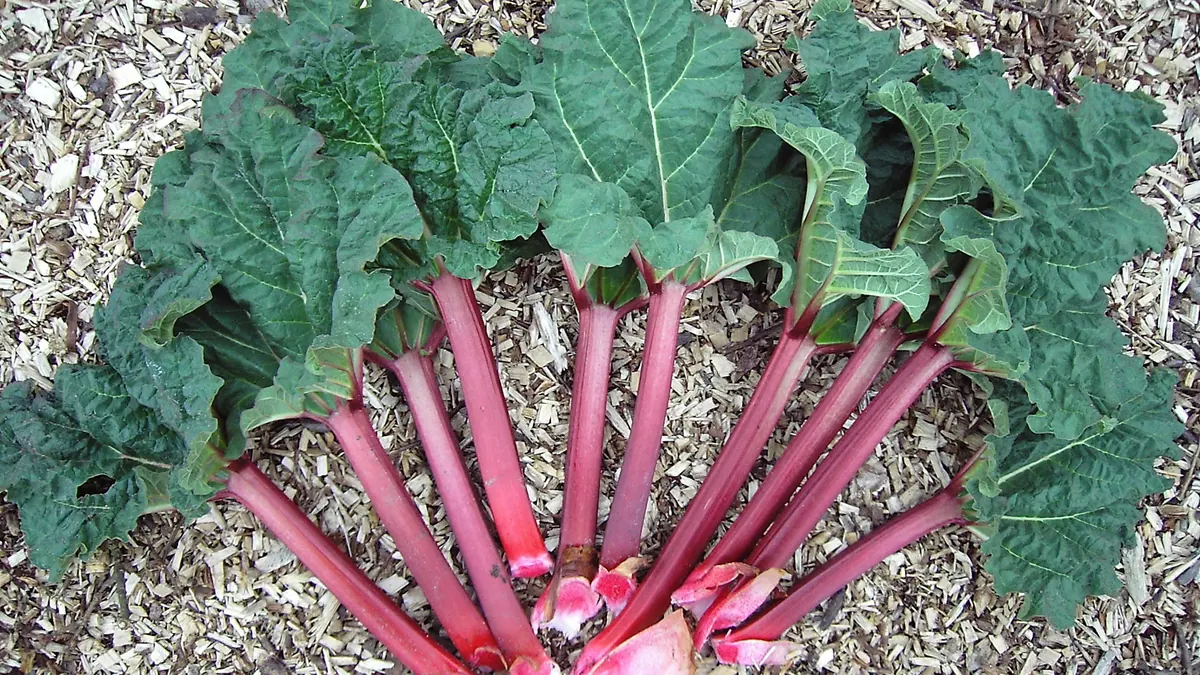
Rhubarb — BMP: 4 studies, weighted mean 368 m³ CH₄/t VS
Rhubarb (leaves and whole plant) is a watery biomass with oxalic acid and anthraquinones; it digests readily, but the acid content lowers the pH of the feed.
Photo Dieter Weber (User:Uellue) / Wikimedia Commons, licence CC BY-SA 3.0, source file; changes: cropping

- Weighted mean
- 368m³ CH₄/t VS
- Range
- 316–490m³ CH₄/t VS
- Records
- 4studies
- Publications
- 2sources
- Temperatures
- 35 °Cof the test
Methane in biogas
High methane content · ≈ 6.7 kWh/m³ of biogas
measured mean of 2 studies BMP, range 67.3–67.6 %; in a batch test the CH₄ share tends to be higher than in a plant.
Rating for biogas plants
neutral — editorial rating for biogas plantsNo clear advantages — worth charging a fee for accepting it
Potential per tonne of fresh matter: moderate (29 m³ CH₄/t); process risk: acidification. No additional handling requirements.
Why? Rating factors
Potential per tonne +1
- +1potential 29 m³ CH₄/t fresh matter (BMP 368 × DM 9.1 % × VS 86 %)
Process stability −0.5
- −0.5acidification: rapid degradation / acidic pH, risk of VFA accumulation, needs buffering
Handling and costs 0
- 0no factors
Total points: 0.5 · thresholds: ≥ 2.5 very good, ≥ 1 good, below — neutral; negative with cumulative process risk.
Add to the co-digestion calculator CSV data
BMP curves from 4 studies
Weighted mean Individual records
Dashed lines are a model curve (first-order kinetics, B(t) = B₀·(1 − e−kt)); the end point comes from the publication. All curves are model curves.
Cumulative methane production over the test [m³ CH₄/t VS]. The thick line is the weighted mean of all records (368); dots mark the end values given in the publications. Point at the chart to read values; click a legend item to hide or show a record.
Records and sources
Download CSV| Source | BMP m³ CH₄/t VS | CH₄ in biogas % vol., measured | Temperature | Sample | Curve |
|---|---|---|---|---|---|
| Lehtomaki (2006) · 1 | 320 | — | 35 °C · mesophilic | Rhubarb | end point (model curve) |
| Lehtomaki (2006) · 2 | 490 | — | 35 °C · mesophilic | Rhubarb | end point (model curve) |
| Zubr (1986) · 1 DOI | 316 | 67.6 % | 35 °C · mesophilic | Rhubarb | end point (model curve) |
| Zubr (1986) · 2 DOI | 345 | 67.3 % | 35 °C · mesophilic | Rhubarb · pretreatment: Silage: Air tight glass jars , fermented 30-40 days at 20 oC. | end point (model curve) |
| Weighted mean | 368 | 67.4 % | arithmetic mean 368, SD 82 | ||
Typical composition
- Dry matter (DM)
- 9.1% (range 8.1–9.4)
- Volatile solids (VS)
- 86 % DM (range 86–86)
- Nitrogen
- 2.9 % DM
- C/N ratio
- 15
Median and range of the determinations reported in the publications behind this substrate's BMP records (read from: CROPGEN D4); dry matter: 3 determinations, volatile solids: 1 determination.
Sources: Lehtomaki (2006); Zubr (1986).
The composition of the raw material varies between batches — for plant calculations use an analysis of your own sample. The calculator inserts typical values automatically.
Process properties
Low confidence: the description is based on general characteristics of the substrate group, not on studies of this material. Treat it as a hint to be verified.
Advantages
- Methane potential in the database: weighted mean 368 m³ CH₄/t VS (median 332; range 316–490; 4 records from 2 sources).
- Large leaves and stems available at plantations; studies Lehtomäki 2006 and Zubr 1986.
Drawbacks and risks
- Rapid degradation may acidify the system (review by Chen 2008).
Co-digestion — what to combine it with, what to watch out for
- combines well
substrates: high alkalinity (buffer) — e.g. Cattle manure, Pig slurry, Cattle slurry, Duck slurry, Rumen and digestive tract content
- caution
substrates: easily degradable — e.g. Maize silage (whole crop), Food waste, Sorghum, whole crop, Whey, Beet leaves and tops
Accumulation of readily degradable compounds increases the risk of acidification.[3][1]
Dosing
No source-based dose limits; initially a small share with monitoring of pH and FOS/TAC.
Introduce gradually, starting with a small dose and monitoring the process (e.g. FOS/TAC, pH, gas composition).
Practical requirements
- Shred: shredding increases the surface available for degradation and speeds it up, but does not necessarily raise the final gas yield (FNR 2010, Ch. 3 “Triturado”).
Sources of the process data
- Chen, Y.; Cheng, J.J.; Creamer, K.S. (2008) Inhibition of anaerobic digestion process: A review. Bioresource Technology
- Weiland, P. (2010) Biogas production: current state and perspectives. Applied Microbiology and Biotechnology
- Lehtomaki, A. Viinikainen, T.A. Rintala, J.A (2006) Screening boreal energy crops and crop residues for methane biofuel production. Submitted to Biomass and Bioenergy
- Zubr, J. (1986) Methanogenic fermentation of fresh and ensiled plant materials. Biomass 11(3), 159–171
- FNR (2010). Guía sobre el Biogás – Desde la producción hasta el uso (hiszp. wydanie „Leitfaden Biogas”, GIZ 2013)
The co-digestion calculator will assess a specific mixture containing this substrate.
What it is and where it comes from
Rhubarb (Rheum rhabarbarum, garden rhubarb) is grown in Poland for its leaf stalks, which are eaten after heat treatment. The leaves are waste, because they are not suitable for consumption owing to oxalic acid. They therefore arise in commercial cultivation, in processing (jams, compotes) and in gardens. The dataset describes leaves and the whole plant.
Properties relevant to digestion
Rhubarb contains a lot of water, soluble sugars, pectins, fibre and small amounts of lignin. The leaves are rich in oxalic acid and its salts and contain anthraquinones, which have an antimicrobial effect, although at moderate shares in the feed they should not block the process. The acidic reaction of the mass lowers the pH of the feed, and oxalates can bind calcium and magnesium. Hydrolysis is rapid. The protein of the leaves supplies nitrogen, so the C/N ratio is moderate. The material spoils quickly.
How to read the spread of results
The dataset contains several records from several sources, all under mesophilic conditions at 35 °C, with a moderate spread. They describe rhubarb without distinction of parts, or leaves and the whole plant, so differences may result from the proportion of leaves and stalks. In addition the variety, age of the plant, harvest date, size reduction, sample preparation and inoculum have an effect. The oxalate content changes during the season.
In biogas plant practice
Rhubarb is a seasonal supplement to the feed, especially on farms with commercial cultivation. After size reduction it is mixed with slurry or silage, while monitoring pH and volatile acids. It spoils quickly, so it should not be stored for long. Waste from processing and trade is waste and requires the appropriate plant authorisations, whereas leaves from own crops can be treated as agricultural products. Oxalic acid is usually not an obstacle to the process at typical doses.
On farms growing rhubarb the waste appears in a strictly defined spring-summer window, so the planning of deliveries should take into account the period in which the feed is supplemented with other raw materials. Ensiling the leaves together with other green forages is sometimes a practical solution for longer storage.
Oxalates form poorly soluble salts with calcium, which can be deposited in the digester and reduce the availability of calcium to microorganisms, so at very high shares of rhubarb it is worth monitoring the mineral composition of the liquid.
Methodology in brief
BMP is the amount of methane obtained from volatile solids (VS) in a batch test, given in m³ CH₄ per tonne of VS (numerically the same as NmL CH₄/g VS in the publications) and converted to normal conditions (0 °C, 101.325 kPa). The weighted mean gives each publication a total weight of 1, split equally between its results for the substrate — a paper testing twenty varieties does not outweigh a paper with a single sample. In inter-laboratory programmes the unit is the laboratory (total weight 1), and within it the weight of a test grows with the number of bottles (replicates). Results after pretreatment (e.g. thermal, chemical, enzymatic) are shown separately and are not included in the mean.
Solid lines are curves measured in the tests. Where a publication gives only the final result, we draw a first-order kinetic model, B(t) = B₀·(1 − e−kt): only the end point comes from the publication, and the shape of the curve serves purely as visualisation — do not read the production on a particular day from it. For this substrate k = 0.134 d−1 was assumed (median of rate constants k reported in the sources and/or fitted to the mean measured curves).
The statistics describe the spread of published results — a descriptive compilation, not a meta-analysis or a guarantee of plant yield.
Bibliography
- Lehtomaki, A. Viinikainen, T.A. Rintala, J.A (2006). Screening boreal energy crops and crop residues for methane biofuel production. Submitted to Biomass and Bioenergy.
- Zubr, J. (1986). Methanogenic fermentation of fresh and ensiled plant materials. Biomass 11(3), 159–171. DOI: 10.1016/0144-4565(86)90064-8 DOI
All sources of the site: bibliography.
Other substrates in the group “Wild, invasive and medicinal plants”

Mexican sunflower (Tithonia diversifolia) — BMP: 2 studies, weighted mean 210 m³ CH₄/t VS
210 m³ CH₄/t VS weighted mean from 2 studies
≈55 %
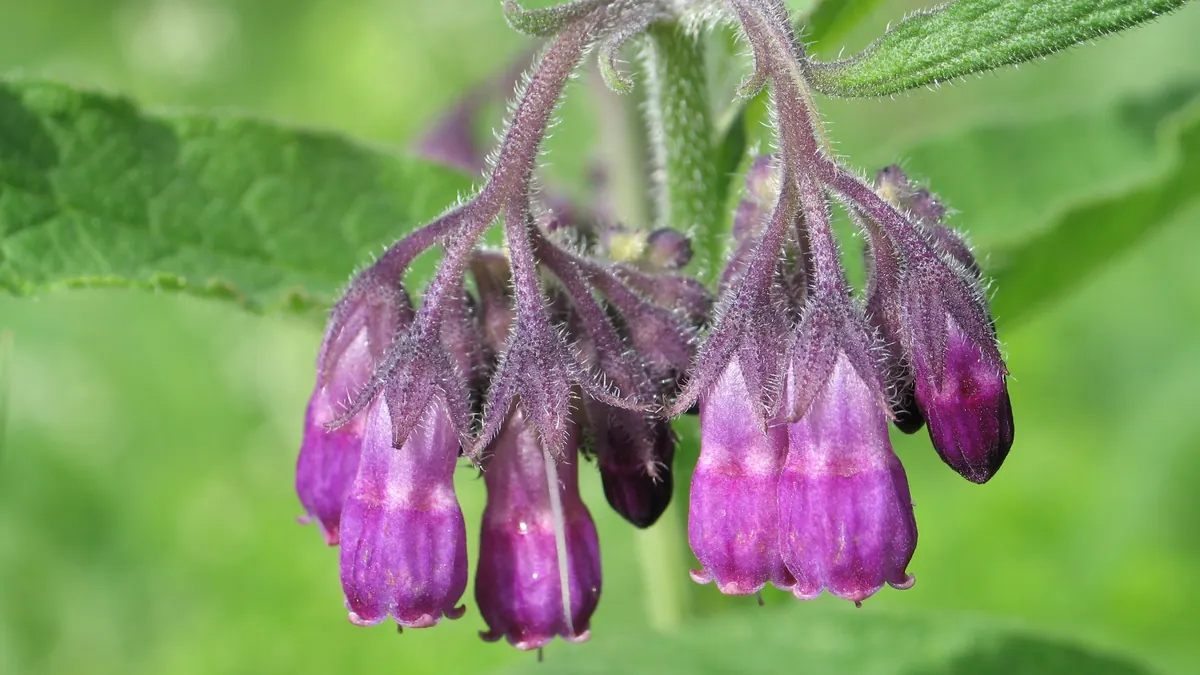
Comfrey — BMP: 2 studies, weighted mean 328 m³ CH₄/t VS
328 m³ CH₄/t VS weighted mean from 2 studies
good — editorial rating for biogas plants70 %
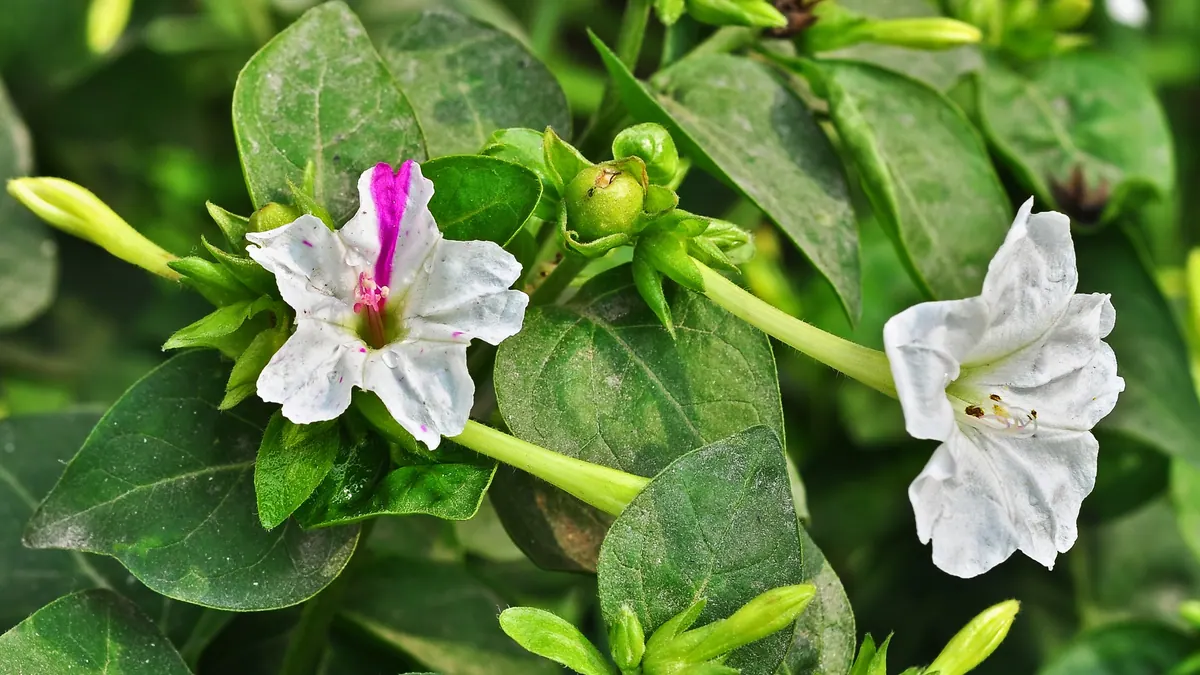
Four o'clock flower leaves — BMP: 5 studies, weighted mean 325 m³ CH₄/t VS
325 m³ CH₄/t VS weighted mean from 5 studies
good — editorial rating for biogas plants≈52 %
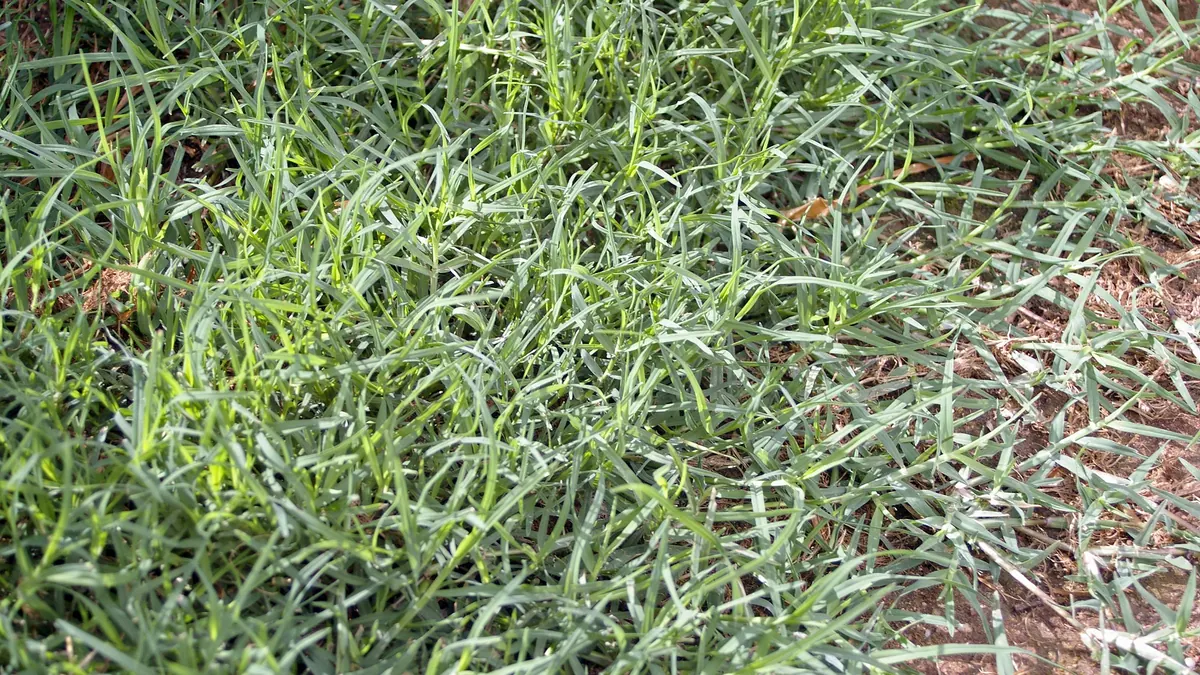
Bermuda grass — BMP: 5 studies, weighted mean 202 m³ CH₄/t VS
202 m³ CH₄/t VS weighted mean from 5 studies
good — editorial rating for biogas plants≈52 %