

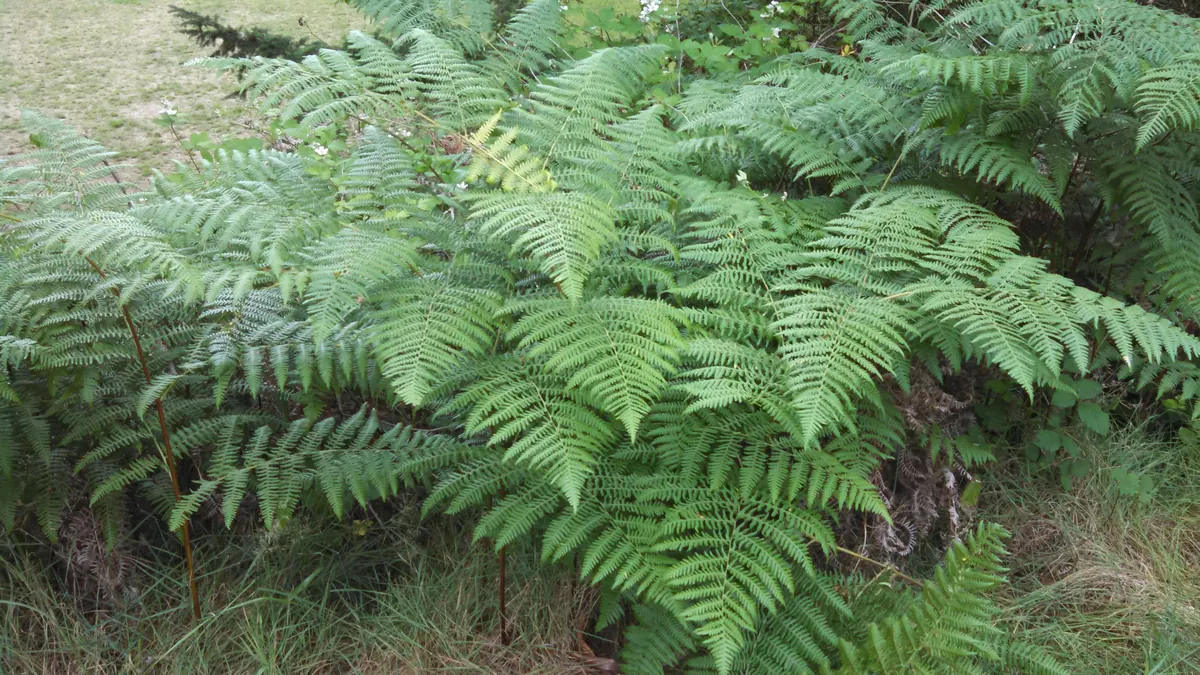
BMP testingWild, invasive and medicinal plantssingle study (3 samples)
Forest underwood plants (ferns, thistles, wild raspberry) — BMP: 3 studies, weighted mean 169 m³ CH₄/t VS
Forest understorey plants (ferns, thistles, wild raspberry – leaves and stems) are three wild-growing plants from a single Latvian study under mesophilic conditions.
Photo brewbooks from near Seattle, USA / Wikimedia Commons, licence CC BY-SA 2.0, source file; changes: cropping

- Weighted mean
- 169m³ CH₄/t VS
- Range
- 60–256m³ CH₄/t VS
- Records
- 3single study (3 samples)
- Publications
- 1source
- Temperatures
- 38 °Cof the test
Methane in biogas
Medium methane content · ≈ 5.2 kWh/m³ of biogas
estimate from the substrate type The collected studies contain no measurement. The interval follows from the approximate composition (carbohydrate-dominated (no protein or fat characteristics)) and the yields of compound groups according to FNR.
Rating for biogas plants
not rated — editorial rating for biogas plants
Not rated: no dry matter or volatile solids in the data. We calculate the rating when the dry matter and volatile solids of the material are known.
Add to the co-digestion calculator CSV data
BMP curves from 3 studies
Weighted mean Individual records
Dashed lines are a model curve (first-order kinetics, B(t) = B₀·(1 − e−kt)); the end point comes from the publication. All curves are model curves.
Cumulative methane production over the test [m³ CH₄/t VS]. The thick line is the weighted mean of all records (169); dots mark the end values given in the publications. Point at the chart to read values; click a legend item to hide or show a record.
Records and sources
Download CSV| Source | BMP m³ CH₄/t VS | Temperature | Sample | Curve |
|---|---|---|---|---|
| Dubrovskis et al. (2021) · 1 DOI | 60 | 38 °C · mesophilic | Ferns (filice) leaves and stalks | end point (model curve) |
| Dubrovskis et al. (2021) · 2 DOI | 191 | 38 °C · mesophilic | Wild raspberries (silva amet) leaves and stalks | end point (model curve) |
| Dubrovskis et al. (2021) · 3 DOI | 256 | 38 °C · mesophilic | Thistles (carduus) leaves and stalks | end point (model curve) |
| Weighted mean | 169 | arithmetic mean 169, SD 100 | ||
Process properties
Low confidence: the description is based on general characteristics of the substrate group, not on studies of this material. Treat it as a hint to be verified.
Advantages
- Methane potential in the database: weighted mean 169 m³ CH₄/t VS (median 191; range 60–256; 3 records from 1 sources).
- A group of plants available as waste from the maintenance of forests and roadsides (ferns, thistles, raspberries) — the Dubrovskis 2021 study from Latvia.
Drawbacks and risks
- Spread of results in the database: standard deviation 100 at a mean of 169 m³ CH₄/t VS (3 records from 1 sources).
Co-digestion — what to combine it with, what to watch out for
- combines well
group: Grasses, green forage and fodder plants
Green forage dilutes poorly degradable fibre and improves the overall result.[1][2]
Dosing
No dose data; only as an additive after a BMP test for the specific mix of species.
Practical requirements
- Shred: shredding increases the surface available for degradation and speeds it up, but does not necessarily raise the final gas yield (FNR 2010, Ch. 3 “Triturado”).
Sources of the process data
- Dubrovskis, V.; Plume, I.; Dubrovskis, D. (2021) Biogas potential from underwood plants. Engineering for Rural Development 20
- Weiland, P. (2010) Biogas production: current state and perspectives. Applied Microbiology and Biotechnology
- Hendriks, A.T.W.M.; Zeeman, G. (2009) Pretreatments to enhance the digestibility of lignocellulosic biomass. Bioresource Technology
- FNR (2010). Guía sobre el Biogás – Desde la producción hasta el uso (hiszp. wydanie „Leitfaden Biogas”, GIZ 2013)
The co-digestion calculator will assess a specific mixture containing this substrate.
What it is and where it comes from
The forest understorey is the layer of plants growing beneath the tree canopy, including ferns (e.g. bracken), thistles (Carduus) and wild raspberry (Rubus idaeus). The dataset contains several records from one Latvian study that examined the leaves and stems of these plants as a potential biogas substrate. These plants grow in forest communities and in clearings; harvesting them is not an organised supply chain.
Properties relevant to digestion
Green leaves are readily fermentable, while stems and leaf veins contain more lignin. Ferns produce specific compounds (including tannins), and some species, such as bracken, contain substances that are toxic to animals; these usually break down in the digester but warrant caution. Thistles are strongly fibrous and spiny, and wild raspberry has lignified shoots. Chopping is necessary to obtain a homogeneous mass.
How to read the spread of results
The records concern three different species from one study, so the differences result from their structure and harvest timing, and not from laboratory differences. All the values share the same test conditions and a single temperature, so variability between studies cannot be seen. The growth stage at harvest, the share of stems relative to leaves, moisture content, degree of chopping and inoculum all have an effect. The results should not be extended to other forest species.
In biogas plant practice
Forest floor biomass is not a regular feedstock: harvesting is labour-intensive and dispersed and may conflict with nature conservation, and access to forests is regulated by law. It may make sense only as an incidental addition, e.g. when making use of residues from forestry work or the maintenance of power lines. A BMP test is always required, along with a check that the material does not contain soil, stones or wood residues.
Methodology in brief
BMP is the amount of methane obtained from volatile solids (VS) in a batch test, given in m³ CH₄ per tonne of VS (numerically the same as NmL CH₄/g VS in the publications) and converted to normal conditions (0 °C, 101.325 kPa). The weighted mean gives each publication a total weight of 1, split equally between its results for the substrate — a paper testing twenty varieties does not outweigh a paper with a single sample. In inter-laboratory programmes the unit is the laboratory (total weight 1), and within it the weight of a test grows with the number of bottles (replicates). Results after pretreatment (e.g. thermal, chemical, enzymatic) are shown separately and are not included in the mean.
Solid lines are curves measured in the tests. Where a publication gives only the final result, we draw a first-order kinetic model, B(t) = B₀·(1 − e−kt): only the end point comes from the publication, and the shape of the curve serves purely as visualisation — do not read the production on a particular day from it. For this substrate k = 0.134 d−1 was assumed (median of rate constants k reported in the sources and/or fitted to the mean measured curves).
The statistics describe the spread of published results — a descriptive compilation, not a meta-analysis or a guarantee of plant yield.
Bibliography
- Dubrovskis, V.; Plume, I.; Dubrovskis, D. (2021). Biogas potential from underwood plants. Engineering for Rural Development 20. DOI: 10.22616/erdev.2021.20.tf305 DOI
All sources of the site: bibliography.
Other substrates in the group “Wild, invasive and medicinal plants”
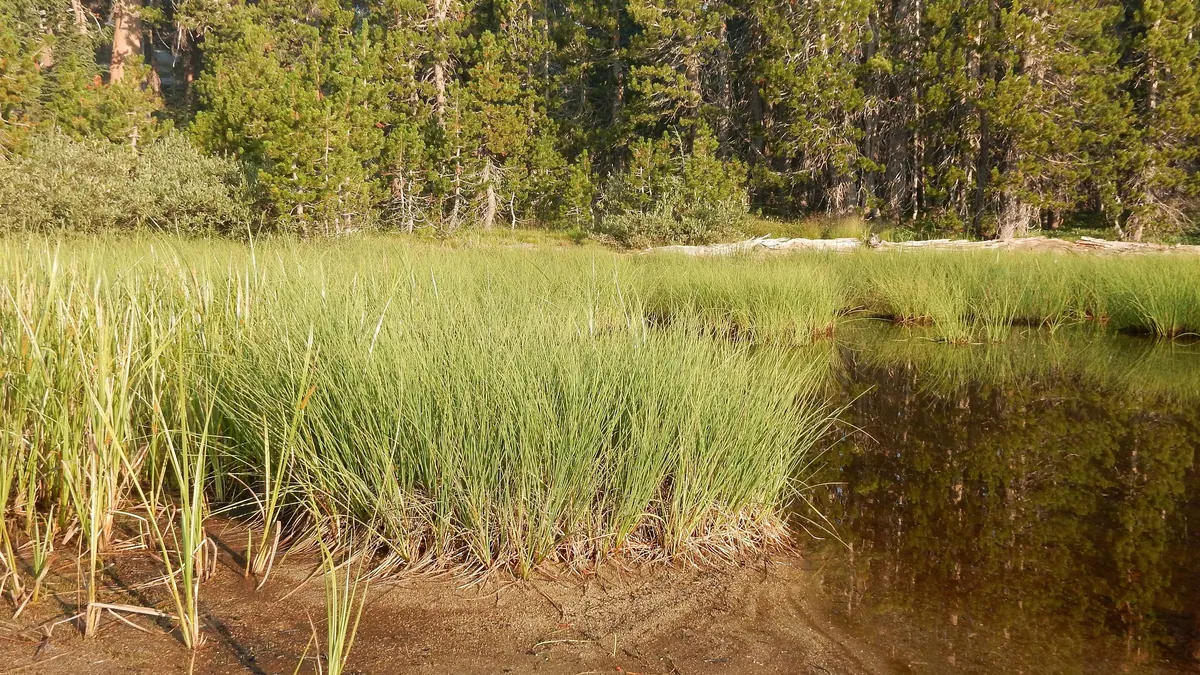
Sedges (Carex spp.) — BMP: 4 studies, weighted mean 204 m³ CH₄/t VS
204 m³ CH₄/t VS weighted mean from 4 studies
≈52 %
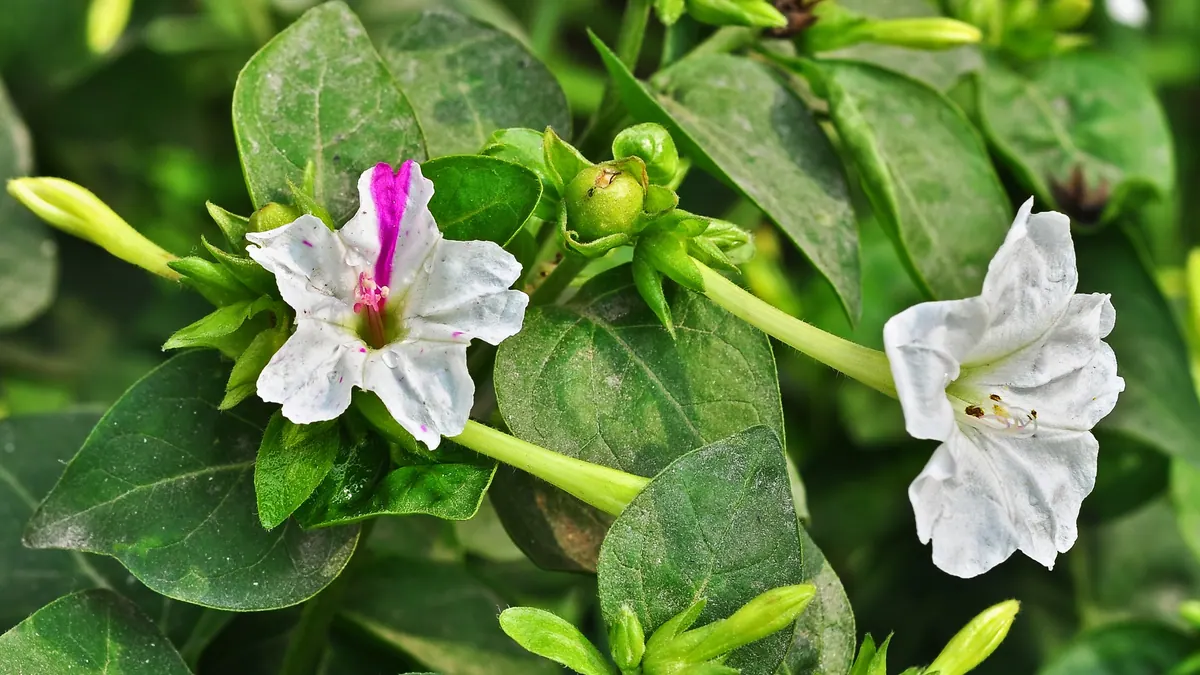
Four o'clock flower leaves — BMP: 5 studies, weighted mean 325 m³ CH₄/t VS
325 m³ CH₄/t VS weighted mean from 5 studies
good — editorial rating for biogas plants≈52 %
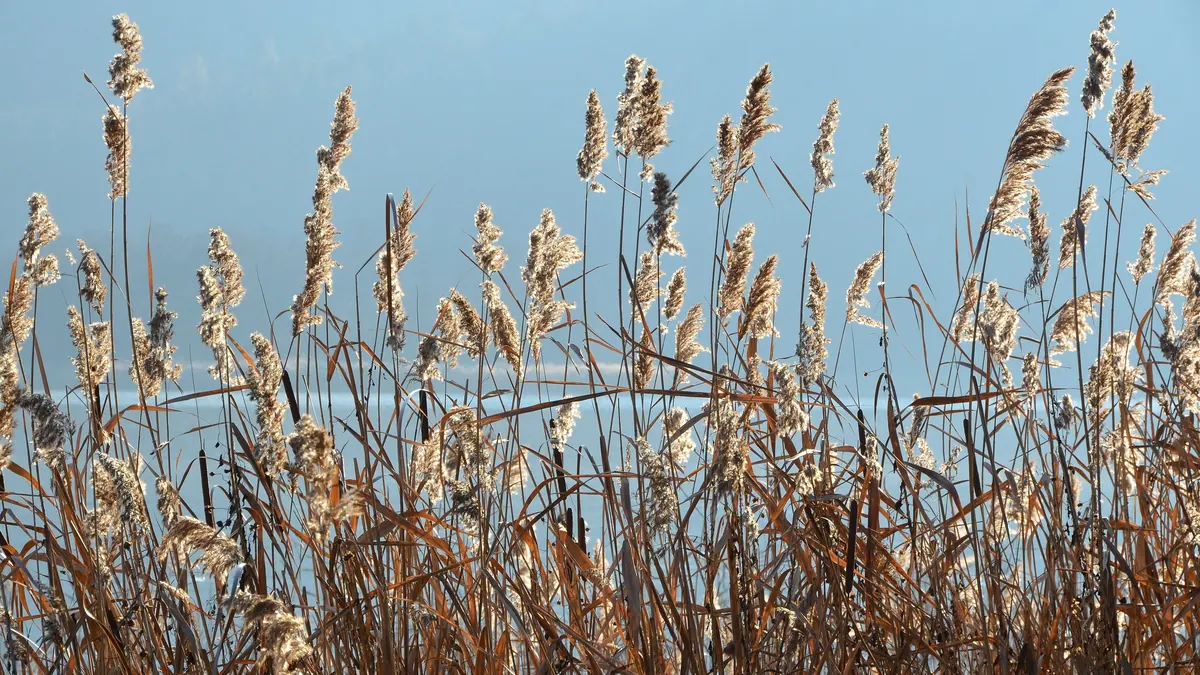
Common reed — BMP: 15 studies, weighted mean 170 m³ CH₄/t VS
170 m³ CH₄/t VS weighted mean from 15 studies
≈52 %
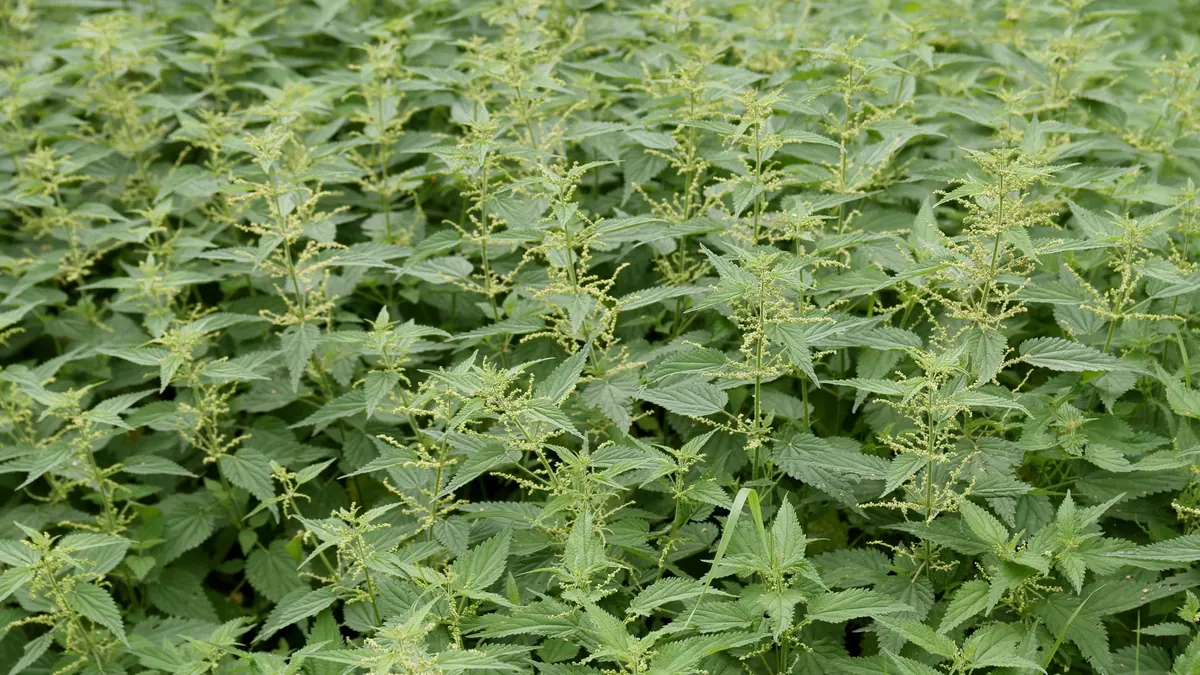
Stinging nettle — BMP: 2 studies, weighted mean 315 m³ CH₄/t VS
315 m³ CH₄/t VS weighted mean from 2 studies
≈52 %