

BMP testingStraws and crop residues
Pepper plant leaves and stems — BMP: 5 studies, weighted mean 170 m³ CH₄/t VS
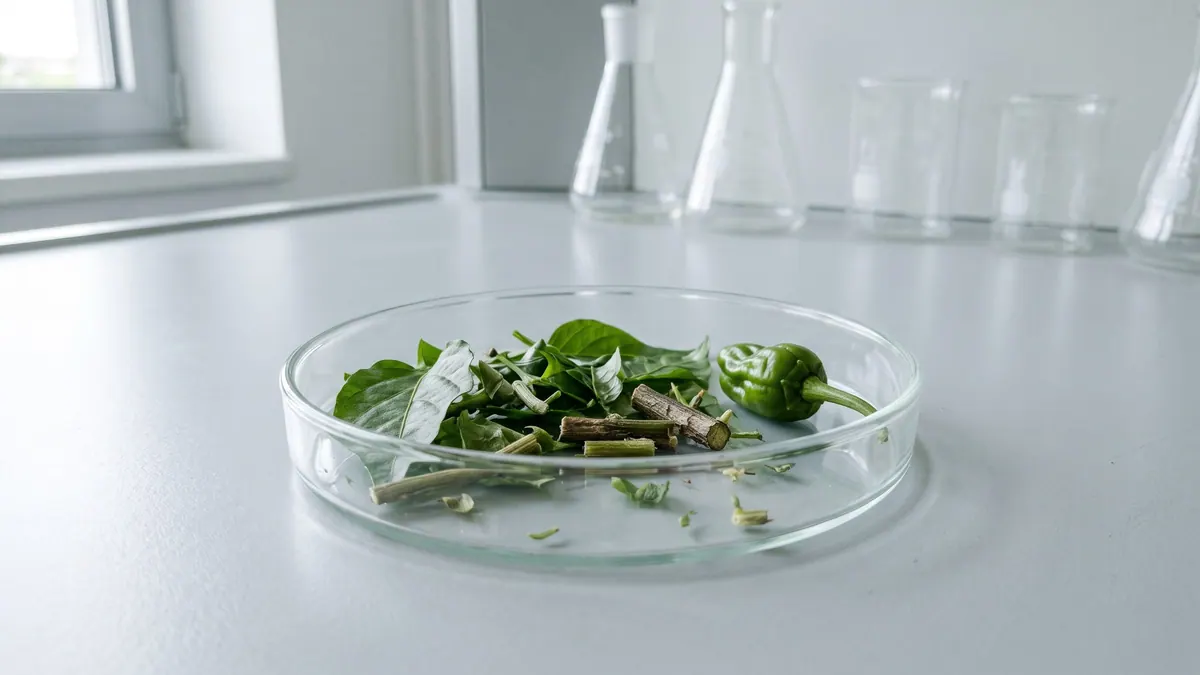
Pepper leaves and stems are waste from greenhouse crops at the end of the season. A mixture of soft and woody fractions, useful as a seasonal addition to the mix.
Illustration: FeedstockData (AI, Google Gemini)
- Weighted mean
- 170m³ CH₄/t VS
- Range
- 121–274m³ CH₄/t VS
- Records
- 5studies
- Publications
- 3sources
- Temperatures
- 36 °C, 38 °Cof the test
Methane in biogas
Medium methane content · ≈ 5.9 kWh/m³ of biogas
measured mean of 1 study BMP; in a batch test the CH₄ share tends to be higher than in a plant.
Rating for biogas plants
not rated — editorial rating for biogas plants
Not rated: no dry matter or volatile solids in the data. We calculate the rating when the dry matter and volatile solids of the material are known.
Add to the co-digestion calculator CSV data
BMP curves from 5 studies
Weighted mean Individual records
Dashed lines are a model curve (first-order kinetics, B(t) = B₀·(1 − e−kt)); the end point comes from the publication. All curves are model curves.
Cumulative methane production over the test [m³ CH₄/t VS]. The thick line is the weighted mean of all records (170); dots mark the end values given in the publications. Point at the chart to read values; click a legend item to hide or show a record.
Records and sources
Download CSV| Source | BMP m³ CH₄/t VS | CH₄ in biogas % vol., measured | Temperature | Sample | Curve |
|---|---|---|---|---|---|
| Cai et al. (2019) · 1 DOI | 163 | — | — | Bell pepper (Capsicum annuum) – Stem | end point (model curve) |
| Cai et al. (2019) · 2 DOI | 205 | — | — | Bell pepper (Capsicum annuum) – Leaf | end point (model curve) |
| Shin et al. (2011) · 1 DOI | 136 | — | 38 °C · mesophilic | Paprika stem | end point (model curve) |
| Shin et al. (2011) · 2 DOI | 274 | — | 38 °C · mesophilic | Paprika leaf | end point (model curve) |
| Li et al. (2018) DOI | 121 | 58.8 % | 36 °C · mesophilic | Capsicum crop residues (CAR) | end point (model curve) |
| Weighted mean | 170 | 58.8 % | arithmetic mean 180, SD 62 | ||
Typical composition
- Volatile solids (VS)
- 79.5 % DM (range 78.5–80.4)
- Nitrogen
- 4.9 % DM
- C/N ratio
- 7.7
Median and range of the determinations reported in the publications behind this substrate's BMP records (read from: BCBPD); dry matter: 0 determinations, volatile solids: 2 determinations. C/N was calculated as the ratio of C and N content (% DM) from the same source. No DM in the sources – the calculator has to ask for a value.
Sources: Cai et al. (2019).
The composition of the raw material varies between batches — for plant calculations use an analysis of your own sample. The calculator inserts typical values automatically.
Process properties
Advantages
- Methane potential in the database: weighted mean 170 m³ CH₄/t VS (median 163; range 121–274; 5 records from 3 sources).
Drawbacks and risks
- Spread of results in the database: standard deviation 62 at a mean of 180 m³ CH₄/t VS (5 records from 3 sources).
Dosing
No source-based dose limits; treat like other horticultural residues.
Introduce gradually, starting with a small dose and monitoring the process (e.g. FOS/TAC, pH, gas composition).
Practical requirements
- Shred: shredding increases the surface available for degradation and speeds it up, but does not necessarily raise the final gas yield (FNR 2010, Ch. 3 “Triturado”).
- Remove foreign contaminants before dosing: material from biowaste may contain interfering substances, and the co-substrate should be free of them (FNR 2010, Ch. 3).
Sources of the process data
- Cai, F.; 1. Biomass Energy and Environmental Engineering Research Center, College of Chemical Engineering, Beijing University of Chemical Technology, Beijing 100029, China; Yan, H.; Zhang, R.; Liu, G.; Chen, C.; 2. Department of Biological and Agricultural Engineering, University of California, Davis, CA 95616, USA (2019) Prediction of methane production performances based on determination of organic components for different vegetable wastes. International Journal of Agricultural and Biological Engineering 12(3), 154–159
- Shin, K.S.; Kim, C.H.; Lee, S.E.; Yoon, Y.M. (2011) Biochemical Methane Potential of Agricultural Byproduct in Greenhouse Vegetable Crops. Korean Journal of Soil Science and Fertilizer 44(6), 1252–1257
- Hendriks, A.T.W.M.; Zeeman, G. (2009) Pretreatments to enhance the digestibility of lignocellulosic biomass. Bioresource Technology
- Li, P.; Li, W.; Sun, M.; Xu, X.; Zhang, B.; Sun, Y. (2018) Evaluation of Biochemical Methane Potential and Kinetics on the Anaerobic Digestion of Vegetable Crop Residues. Energies 12(1), 26
- Weiland, P. (2010) Biogas production: current state and perspectives. Applied Microbiology and Biotechnology
- FNR (2010). Guía sobre el Biogás – Desde la producción hasta el uso (hiszp. wydanie „Leitfaden Biogas”, GIZ 2013)
The co-digestion calculator will assess a specific mixture containing this substrate.
What it is and where it comes from
Pepper (Capsicum annuum) is grown in the field and in greenhouse facilities. After harvest ends, whole plants are removed together with leaves and shoots. Because pepper forms a fairly woody plant, the share of stems in the waste is marked. The compilation covers studies examining stems and leaves separately and whole crop residues, from several countries.
Properties relevant to digestion
Pepper leaves are more digestible than stems, which contain more lignocellulosic structures. The waste is moist and spoils quickly after removal from the crop. For a biogas plant the relevant points are: the need for size reduction, the possibility of forming a floating crust at a high share of stems, and artificial contaminants from the greenhouse (strings, clips, film). The C/N ratio is higher than in protein-rich wastes but lower than in straw, so the material works well with slurry. Residues of plant protection products may be present in plants from intensive cultivation.
How to read the spread of results
Differences between records result above all from the fact that stems, leaves and a mixture of crop residues are being compared. Added to this are the variety, the growing system, the age of the plants and the date of their removal. Samples in the studies were prepared in different ways (dried, milled, frozen), and the tests were run with different inocula and substrate-to-inoculum ratios. The test temperature for some records was not given in the source, so comparing them with each other requires caution.
In biogas plant practice
Like other horticultural residues, pepper is available seasonally and dispersed. It is suitable as a supplement to the ration in regions with a high concentration of cultivation under cover. Before feeding it must be size-reduced and cleared of foreign elements. It can be ensiled together with other plant residues, which stabilises the material until use. Because of the variability of batch composition, it is best to run a BMP test before signing a supply agreement. It should also be ensured that the type of waste is consistent with the range of substrates for which the plant has formal approval. In planning the dose it must be taken into account that the material appears once at the end of the season and is unavailable for the rest of the year; longer ensiling therefore requires space in the silo and protection against precipitation. A small share in the ration usually does not affect process stability, but it is worth monitoring the volatile fatty acid concentration after each larger delivery.
Methodology in brief
BMP is the amount of methane obtained from volatile solids (VS) in a batch test, given in m³ CH₄ per tonne of VS (numerically the same as NmL CH₄/g VS in the publications) and converted to normal conditions (0 °C, 101.325 kPa). The weighted mean gives each publication a total weight of 1, split equally between its results for the substrate — a paper testing twenty varieties does not outweigh a paper with a single sample. In inter-laboratory programmes the unit is the laboratory (total weight 1), and within it the weight of a test grows with the number of bottles (replicates). Results after pretreatment (e.g. thermal, chemical, enzymatic) are shown separately and are not included in the mean.
Solid lines are curves measured in the tests. Where a publication gives only the final result, we draw a first-order kinetic model, B(t) = B₀·(1 − e−kt): only the end point comes from the publication, and the shape of the curve serves purely as visualisation — do not read the production on a particular day from it. For this substrate k = 0.136 d−1 was assumed (median of rate constants k reported in the sources and/or fitted to the mean measured curves).
The statistics describe the spread of published results — a descriptive compilation, not a meta-analysis or a guarantee of plant yield.
Bibliography
- Cai, F.; 1. Biomass Energy and Environmental Engineering Research Center, College of Chemical Engineering, Beijing University of Chemical Technology, Beijing 100029, China; Yan, H.; Zhang, R.; Liu, G.; Chen, C.; 2. Department of Biological and Agricultural Engineering, University of California, Davis, CA 95616, USA (2019). Prediction of methane production performances based on determination of organic components for different vegetable wastes. International Journal of Agricultural and Biological Engineering 12(3), 154–159. DOI: 10.25165/j.ijabe.20191203.4705 DOI
- Shin, K.S.; Kim, C.H.; Lee, S.E.; Yoon, Y.M. (2011). Biochemical Methane Potential of Agricultural Byproduct in Greenhouse Vegetable Crops. Korean Journal of Soil Science and Fertilizer 44(6), 1252–1257. DOI: 10.7745/kjssf.2011.44.6.1252 DOI
- Li, P.; Li, W.; Sun, M.; Xu, X.; Zhang, B.; Sun, Y. (2018). Evaluation of Biochemical Methane Potential and Kinetics on the Anaerobic Digestion of Vegetable Crop Residues. Energies 12(1), 26. DOI: 10.3390/en12010026 DOI
All sources of the site: bibliography.
Other substrates in the group “Straws and crop residues”
Barley straw — BMP: 8 studies, weighted mean 238 m³ CH₄/t VS
238 m³ CH₄/t VS weighted mean from 8 studies
good — editorial rating for biogas plants≈52 %
Sorghum straw (stover) — BMP: 9 studies, weighted mean 334 m³ CH₄/t VS
334 m³ CH₄/t VS weighted mean from 9 studies
good — editorial rating for biogas plants≈52 %
Oat straw — BMP: 2 studies, weighted mean 275 m³ CH₄/t VS
275 m³ CH₄/t VS weighted mean from 2 studies
≈52 %
Cereal straw (unspecified) — BMP: 25 studies, weighted mean 268 m³ CH₄/t VS
268 m³ CH₄/t VS weighted mean from 25 studies
good — editorial rating for biogas plants≈51 %