Optical gas imaging (OGI): a guide for biogas plants, biomethane plants and landfills
What OGI is, how a camera that "sees" methane works, when it fails, what leaks cost and which regulations (EU 2024/1787, EN 17628, EPA) apply to biogas plants, biomethane plants and landfills.
Other language versions: polski.
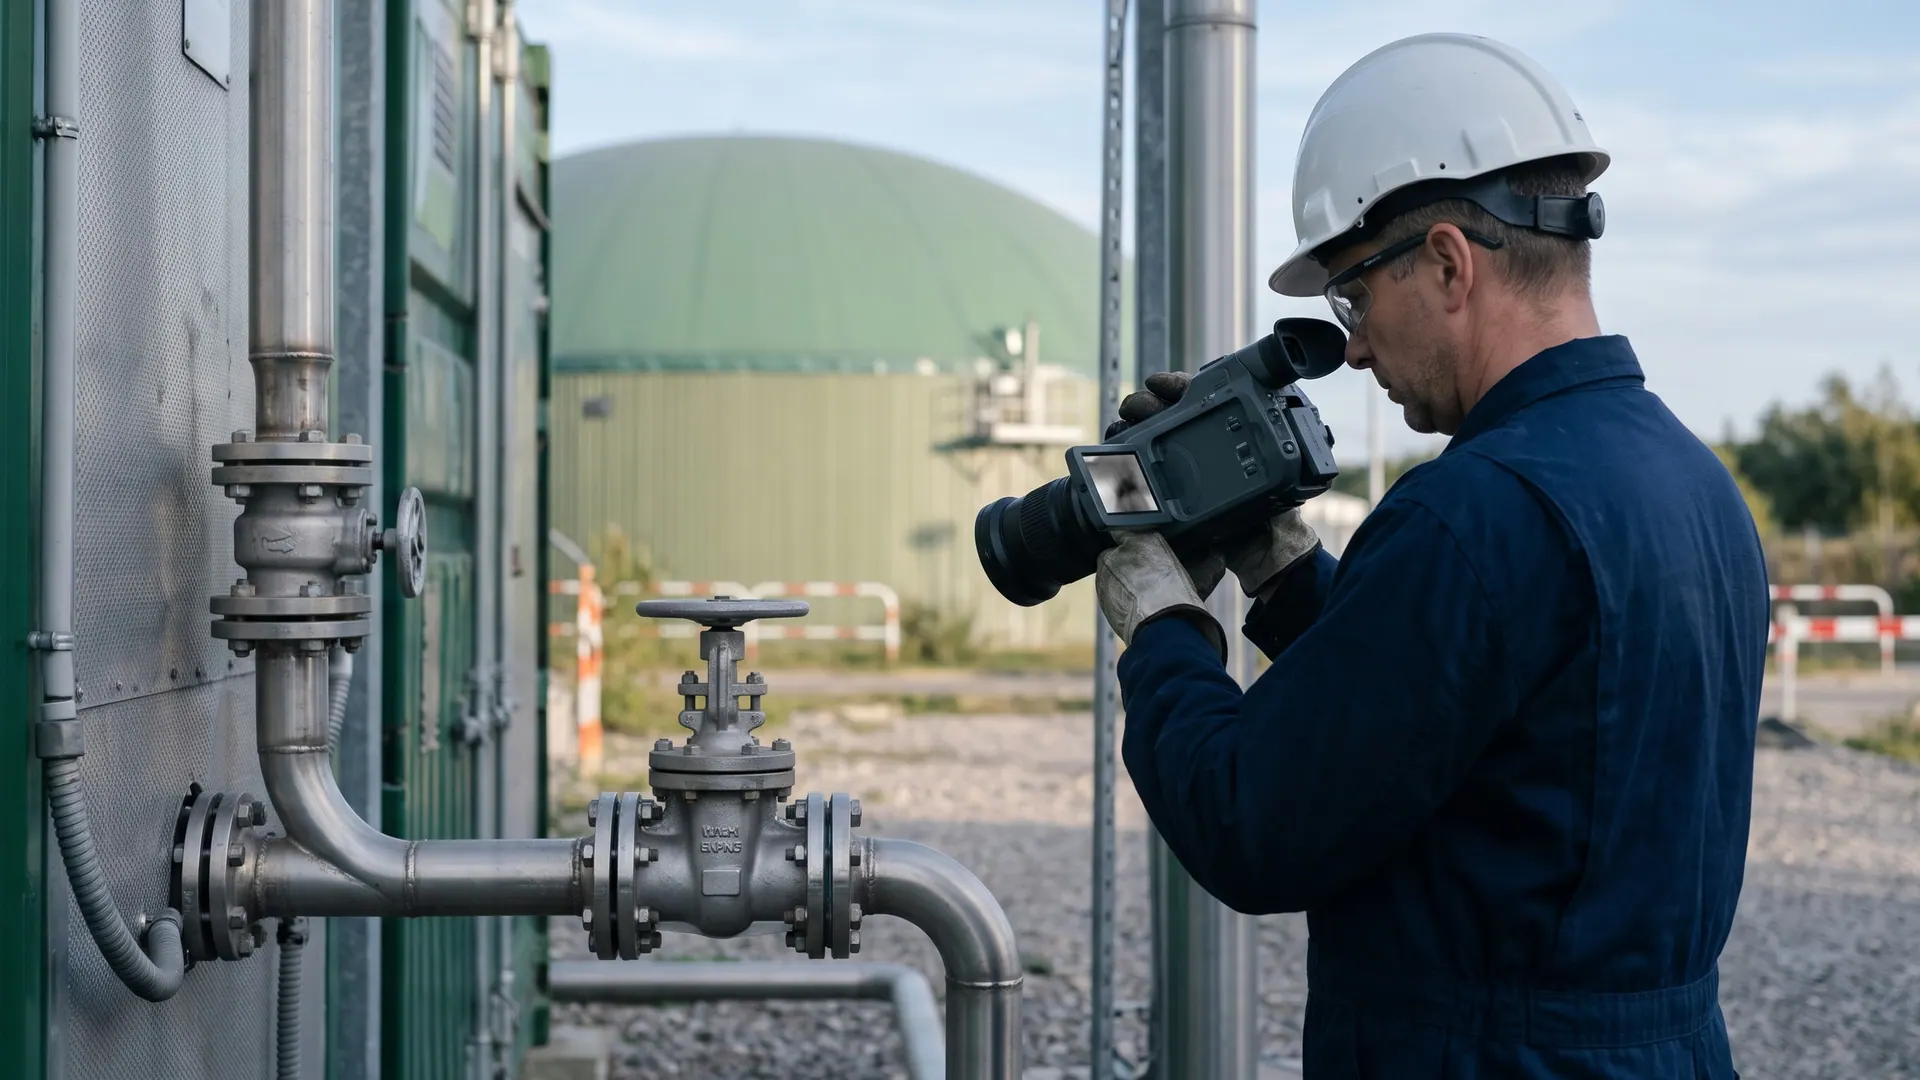
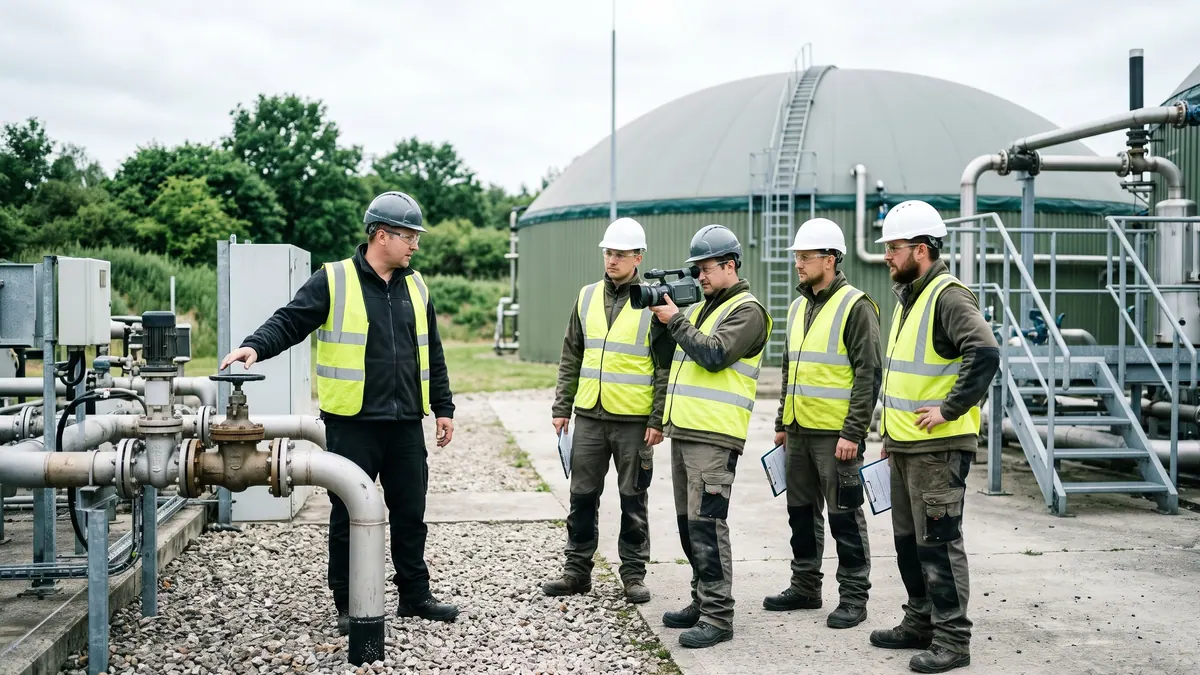
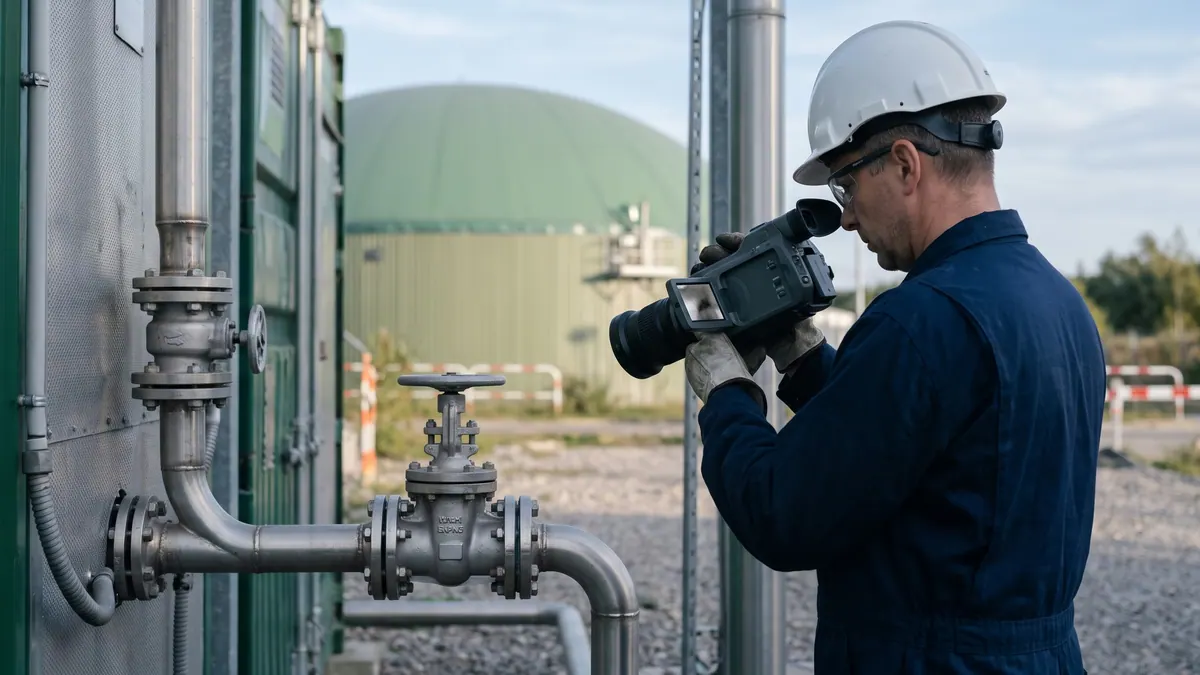
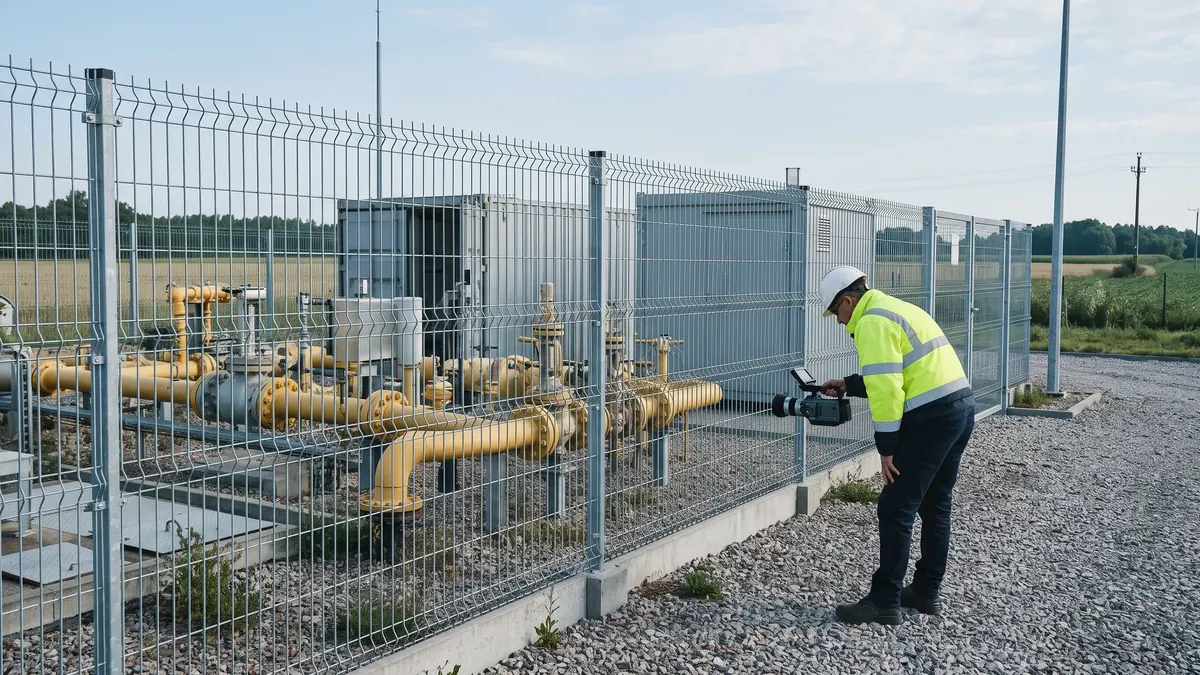
 Operator w ŚOI patrzy przez ręczną kamerę OGI na zawór i kołnierz rurociągu przy kontenerze uszlachetniania biometanu. Illustrative image (AI) — FeedstockData, Google Gemini
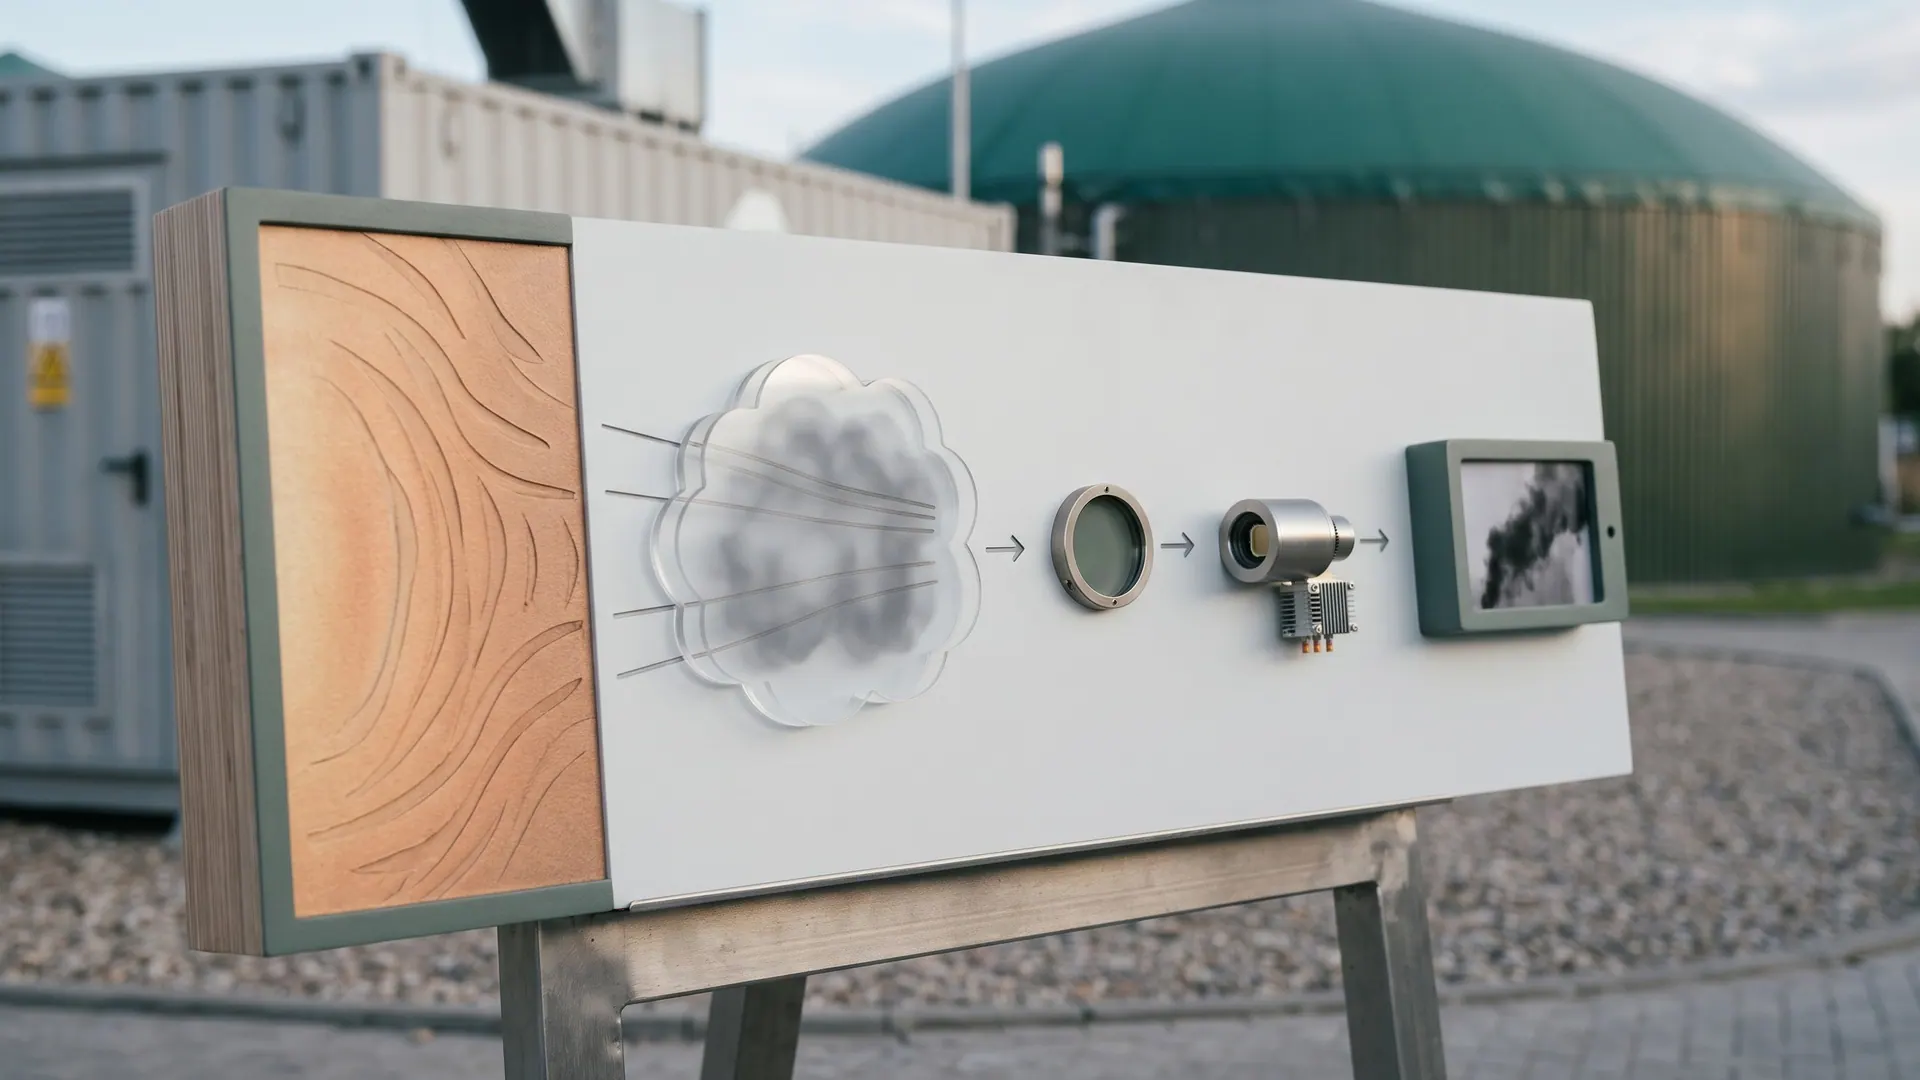
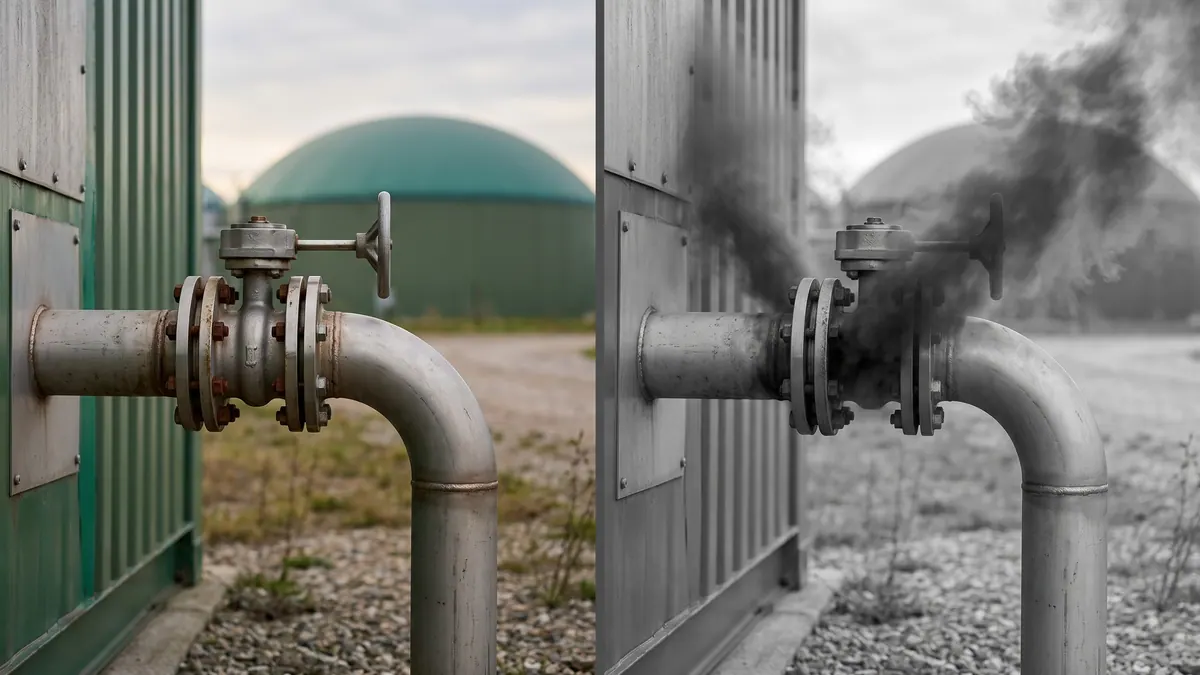
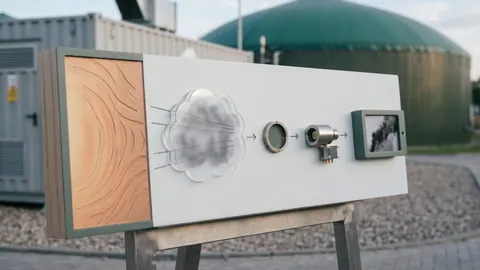 Tablica ze schematem zasady OGI bez opisów: ciepłe tło, chmura gazu pochłaniająca promieniowanie, filtr, detektor i ekran ze smugą gazu. Illustrative image (AI) — FeedstockData, Google Gemini
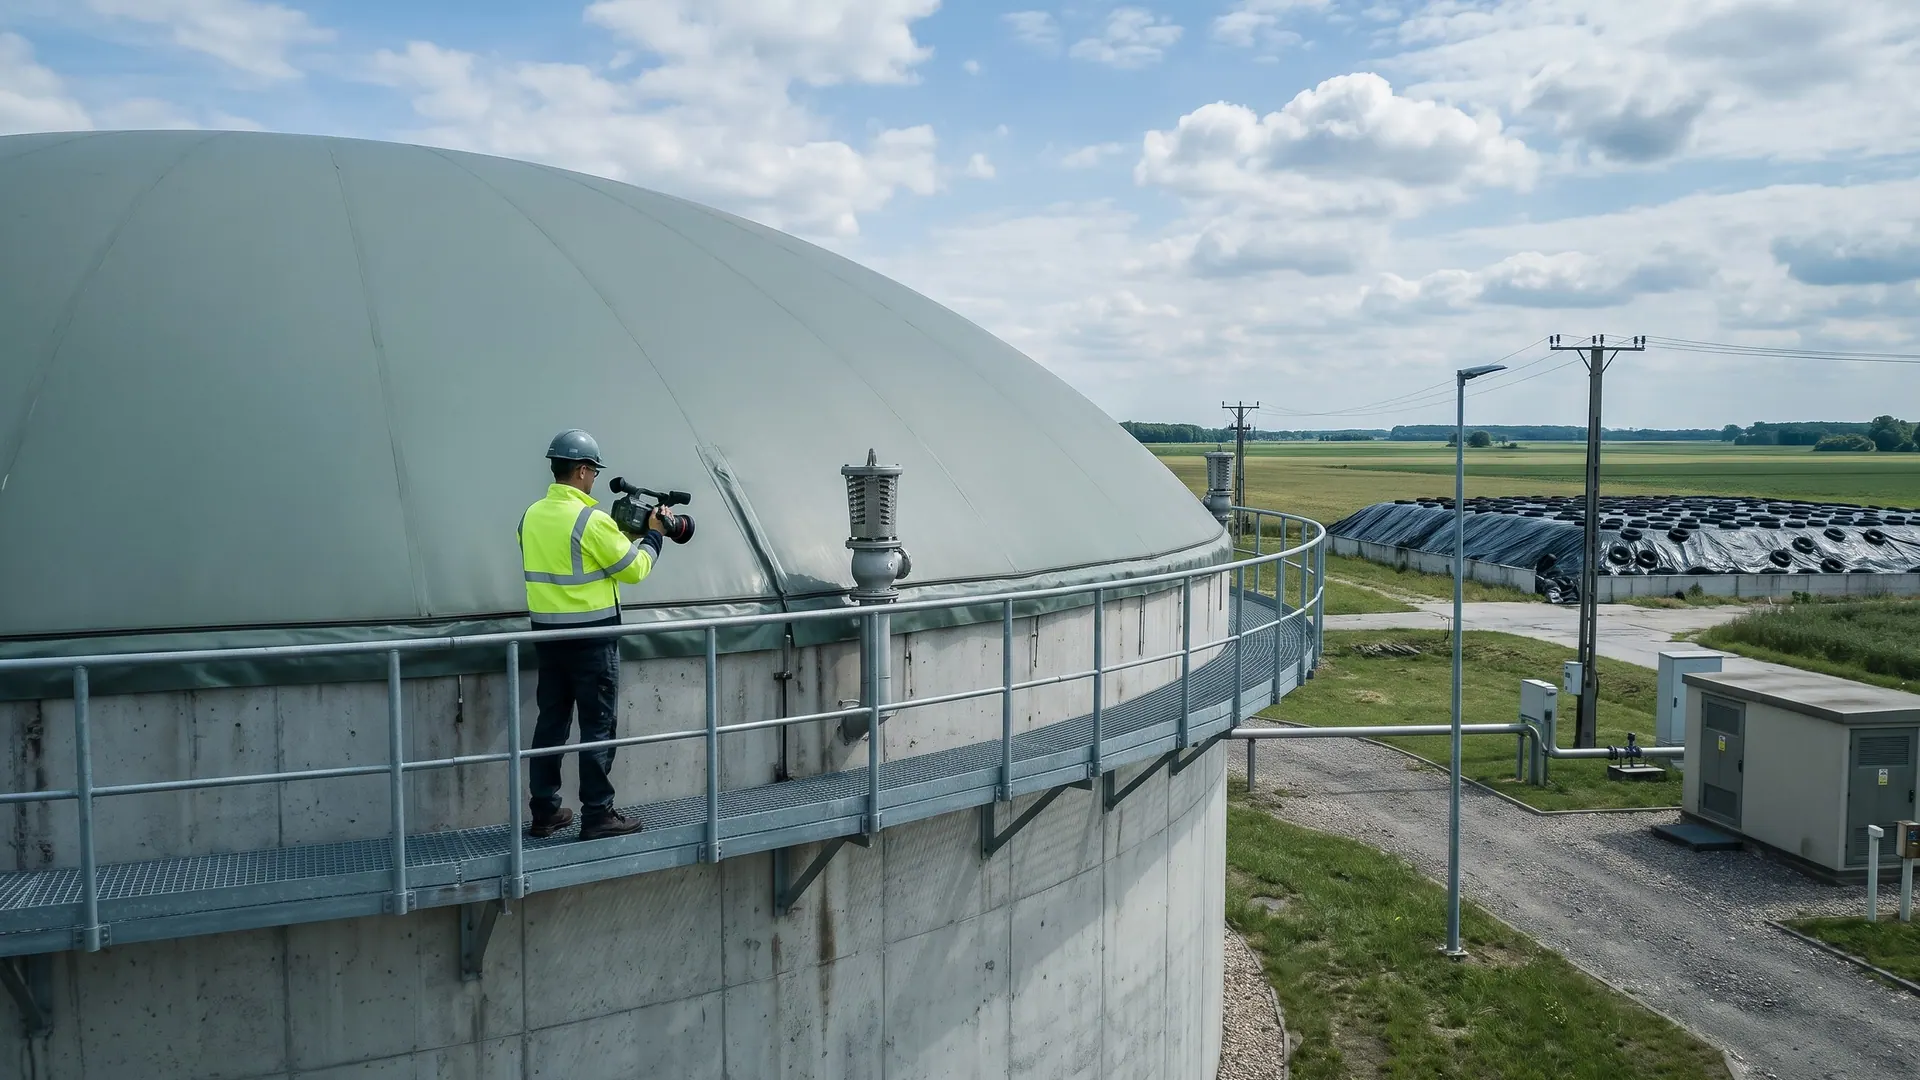
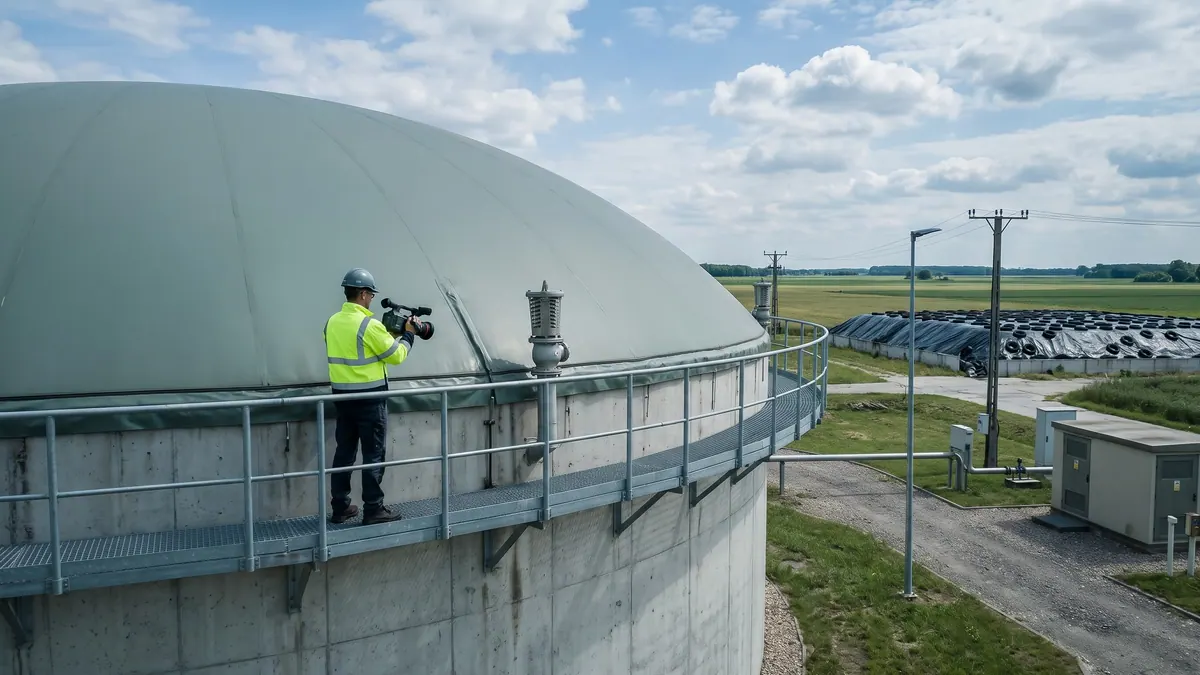
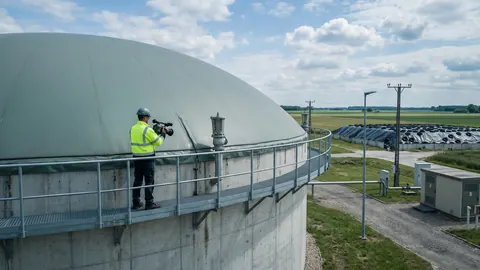 Inspektor z kamerą OGI na pomoście zbiornika fermentacyjnego z dachem dwumembranowym, sprawdza zawór nad- i podciśnieniowy i obrzeże membrany. Illustrative image (AI) — FeedstockData, Google Gemini
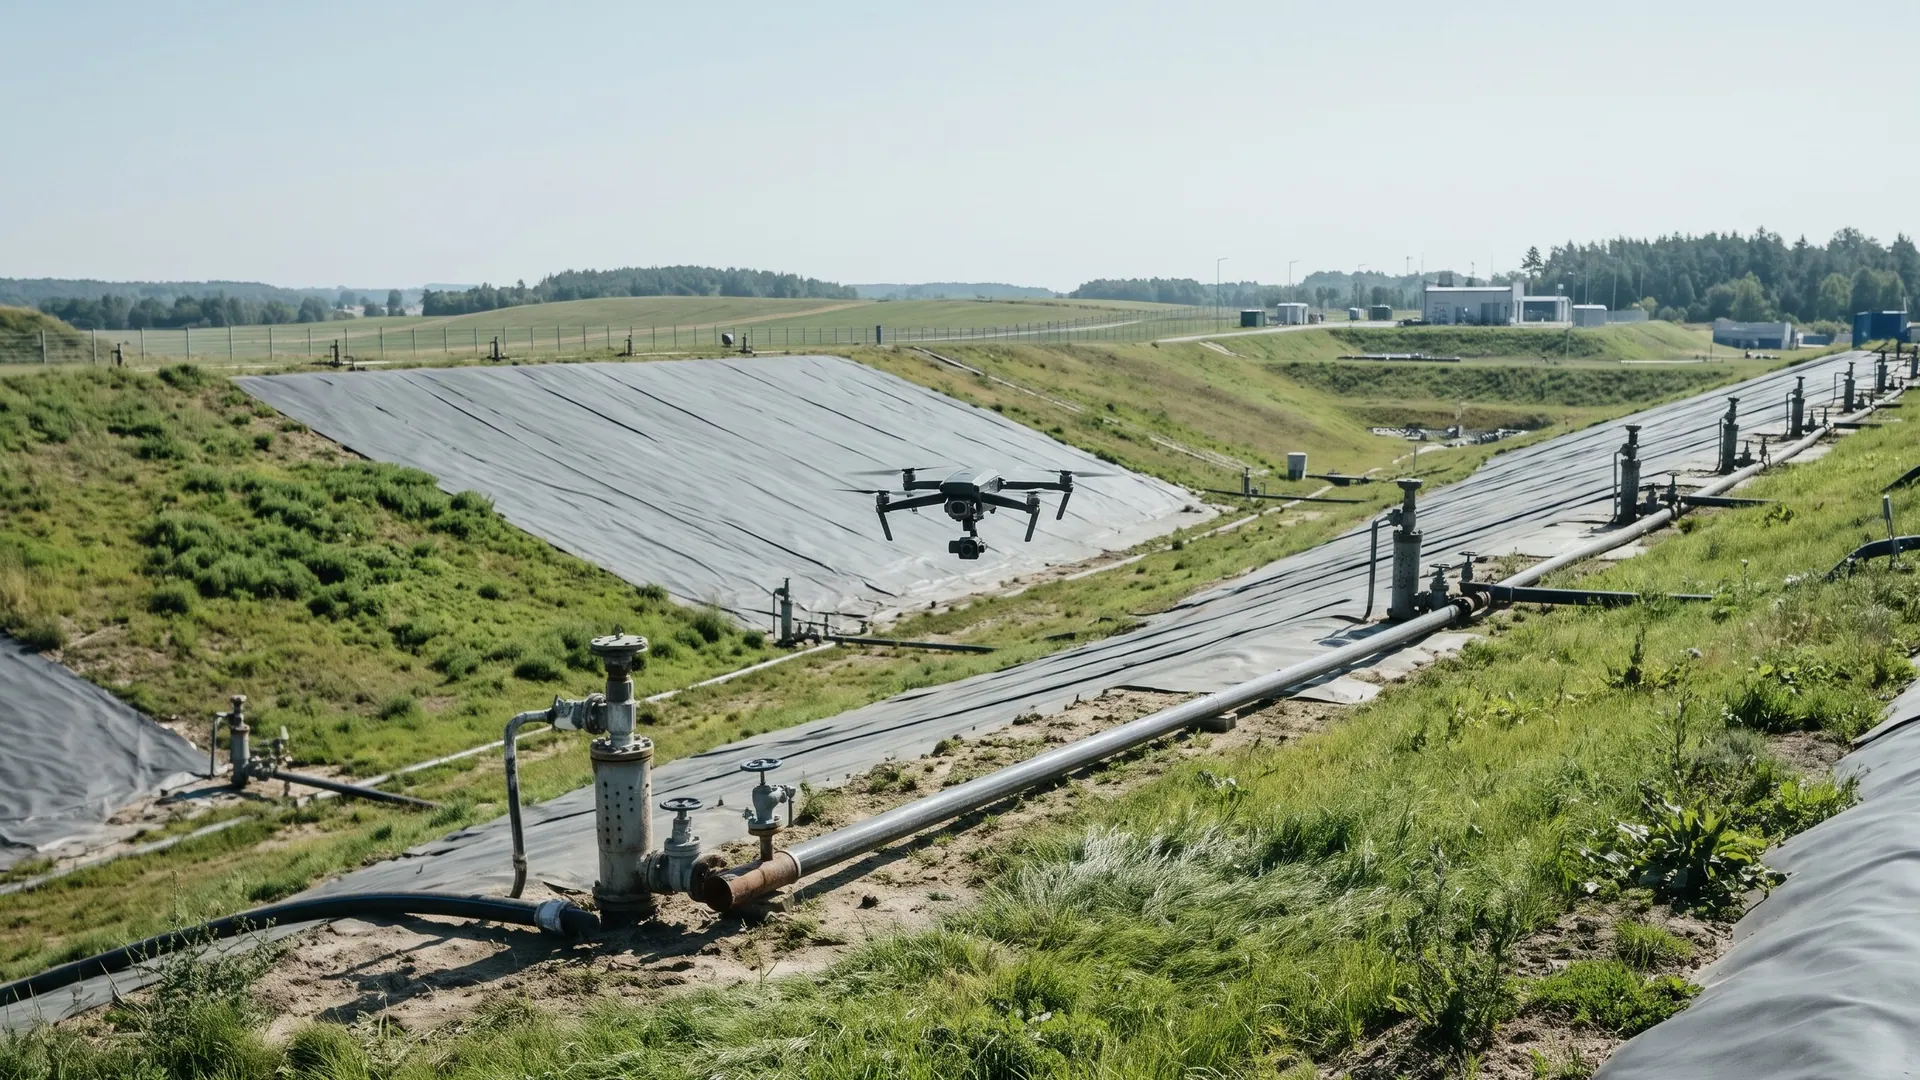
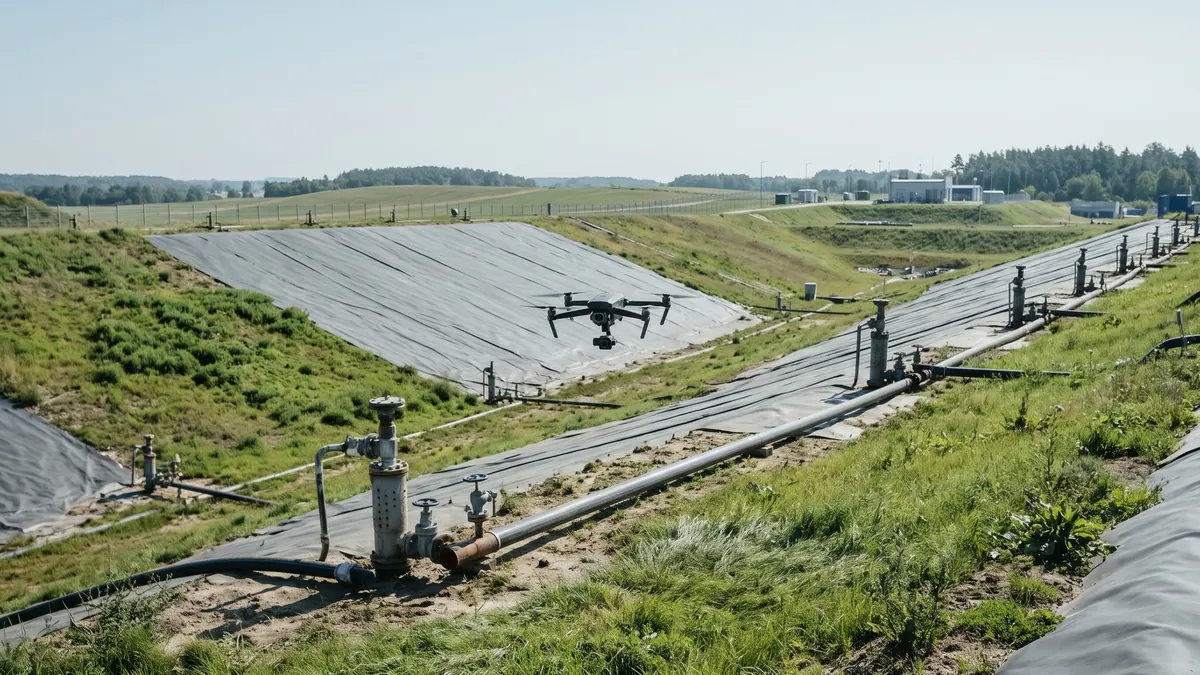
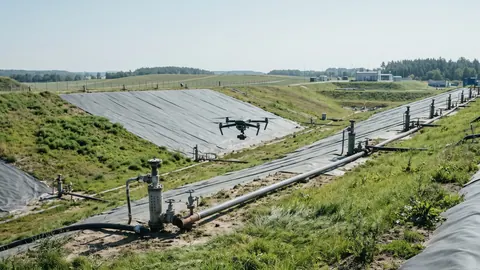 Dron z kamerą w gimbalu nisko nad kwaterą składowiska odpadów z systemem odgazowania: studnie, rury zbiorcze i geomembrana. Illustrative image (AI) — FeedstockData, Google Gemini
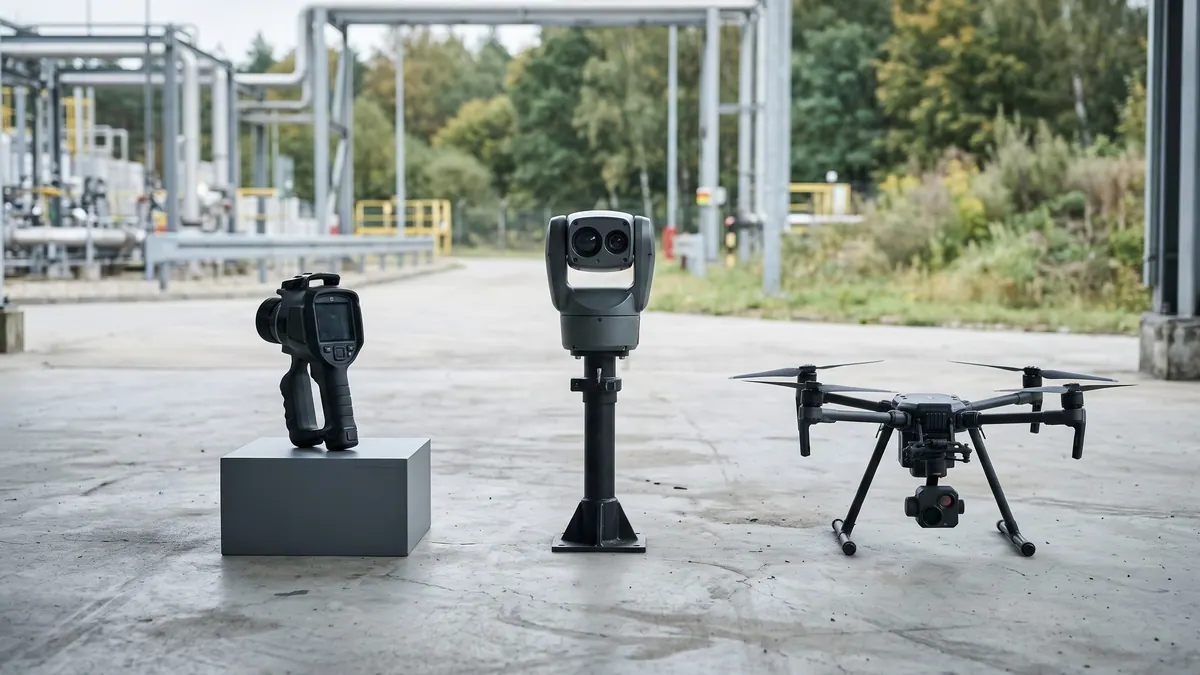
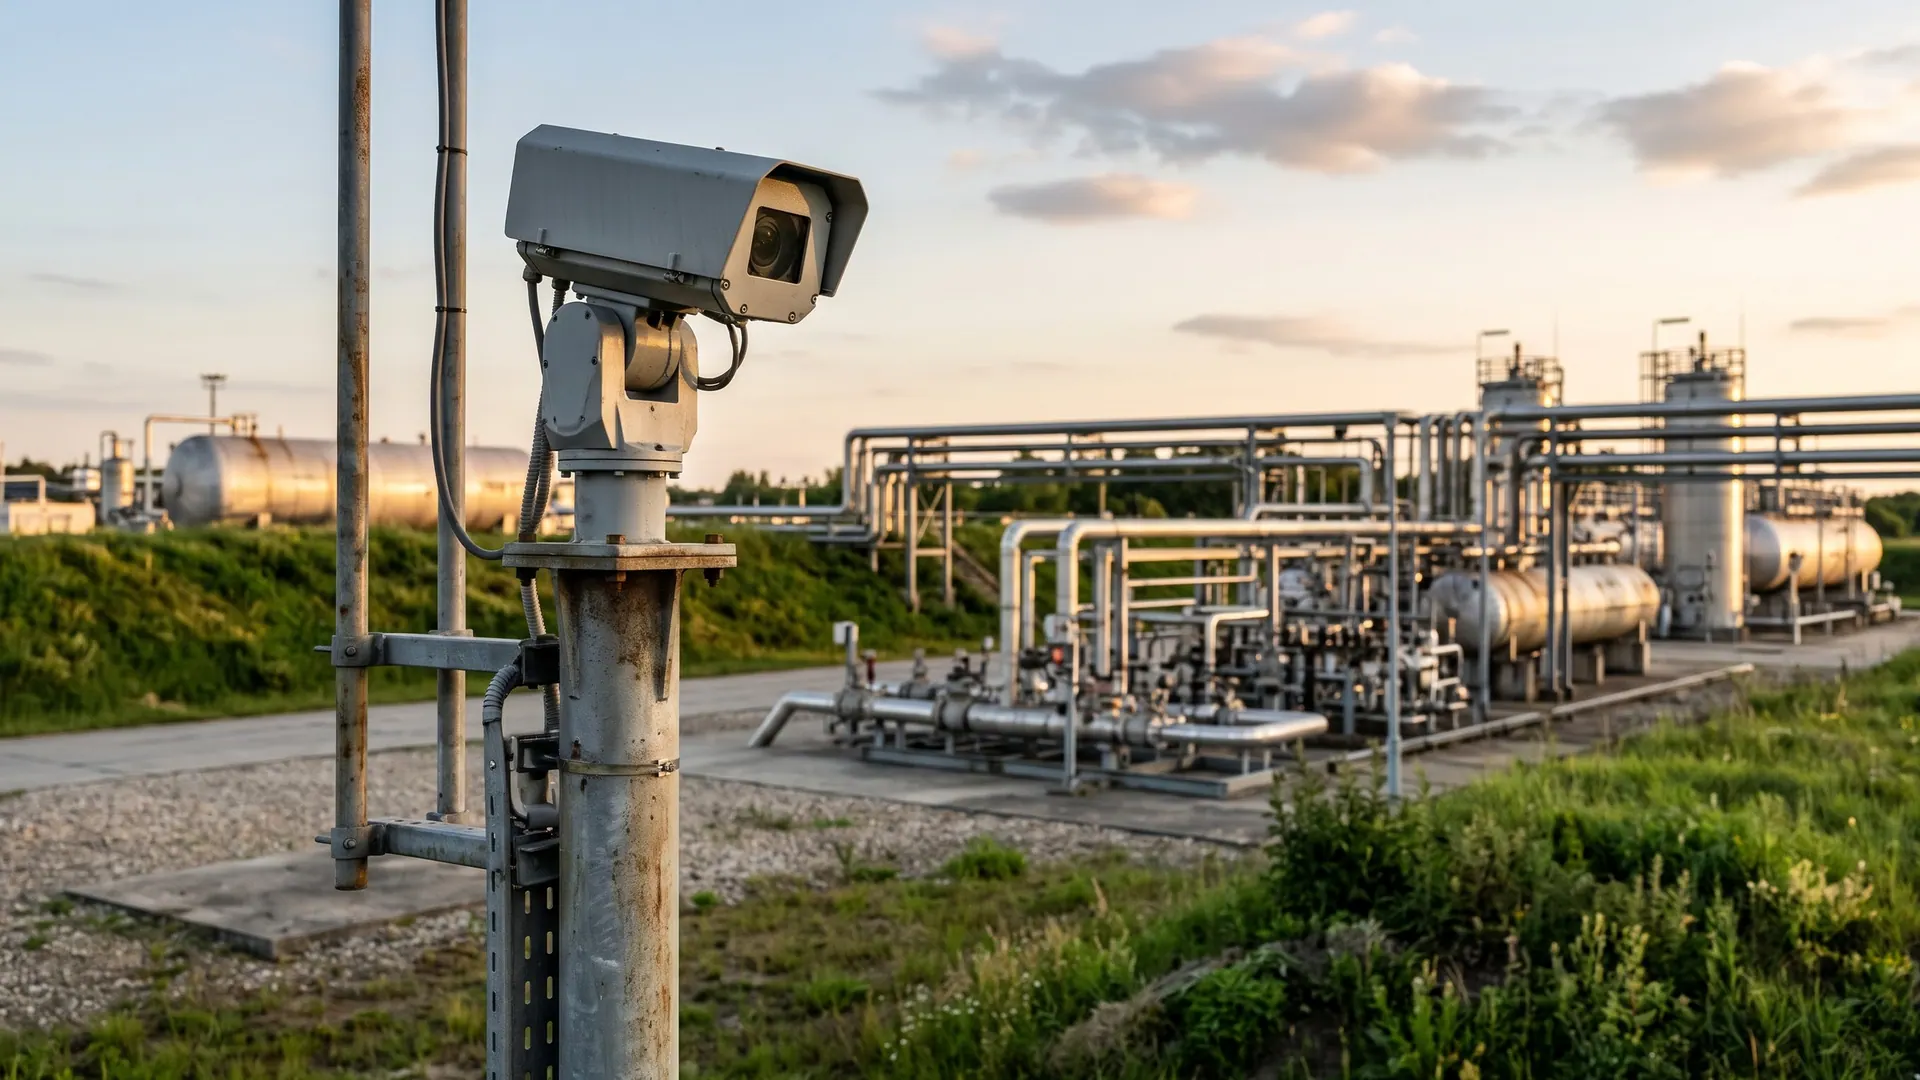
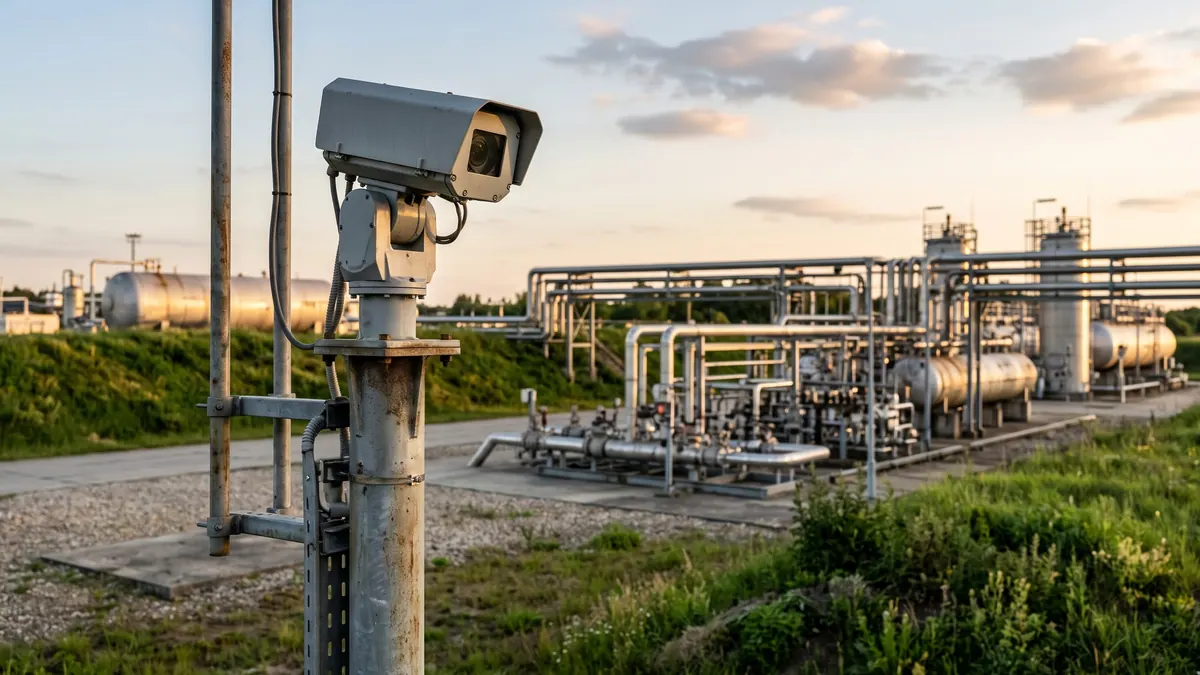
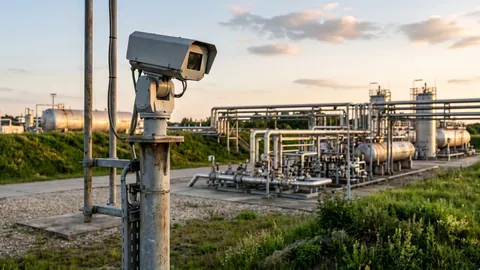 Stacjonarna kamera OGI w obudowie na maszcie z głowicą obrotową, obserwująca instalację do monitoringu ciągłego. Illustrative image (AI) — FeedstockData, Google Gemini
Optical gas imaging (OGI) is a technique in which a special infrared camera shows an invisible gas cloud, for example of methane, on the screen like a plume of smoke; it makes it possible to find leaks quickly on a large installation, without approaching the source and without shutting down the process. For operators of biogas plants, biomethane plants and landfills it is one of the most convenient tools of a leak detection and repair (LDAR) programme. This text explains how OGI works, what it cannot do, how much it can save and which regulations apply to it.
What OGI is and how it differs from ordinary thermal imaging
An ordinary thermal imaging camera records the infrared radiation emitted by objects and converts it into surface temperature. It therefore shows that a pipe is hot or that a busbar in a cabinet is overheated. An OGI camera uses the same kind of detector but additionally has a spectral filter that lets through only a narrow range of wavelengths in which the chosen gas absorbs radiation.
The result is that the image does not show the temperature of the gas. It shows how much background radiation the gas has absorbed on the way to the camera. Where there is a gas cloud, the background looks darker or lighter, and the movement of the plume can be seen on the video. That is why real-time imaging, rather than single photographs, is used to look for leaks.
In practice an OGI camera gives three things that an ordinary thermal imager or a point sensor cannot:
- a view from a distance: several or a dozen or so metres from the source, including from inaccessible places (tank roofs, pipelines under a hall ceiling);
- speed: a single survey covers hundreds of points (flanges, valves, penetrations) instead of measuring each one separately;
- documentation: a video recording of the leak with its location and time.
How it works: physics without formulae
Every gas molecule absorbs infrared only at strictly defined "colours" (wavelengths), which depend on the structure of the molecule. Methane absorbs strongly in several bands. According to a 2026 review paper these are: a short-wave band of 2.31–2.39 µm, the mid-wave band (MWIR) of 3.2–3.55 µm, in which carbon–hydrogen bonds vibrate, and the long-wave band (LWIR) of 7.2–8.3 µm.
The principle of operation is as follows:
- Behind a potential leak there is a background (ground, wall, sky) that itself emits infrared.
- The radiation passes through the gas cloud, and the gas absorbs the wavelengths it "likes".
- The filter in the camera cuts off everything outside the gas band.
- The detector sees the difference: the place with gas is darker or lighter than its surroundings.
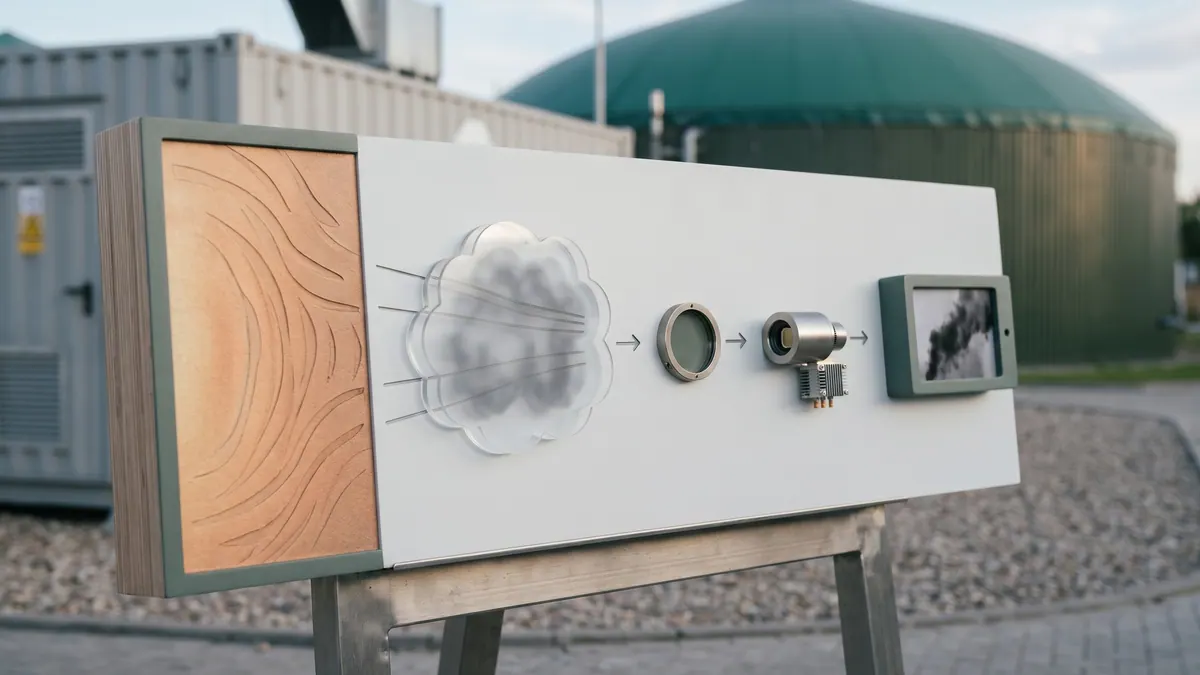
Bands, filters and types of camera
Cooled cameras have a detector cooled to a low temperature and a built-in narrow filter passing 3.2–3.55 µm. This solution is the most sensitive to methane and other hydrocarbons and therefore dominates in LDAR surveys. Uncooled (microbolometer) cameras work in a broad long-wave band of 6.5–14 µm, and for methane a filter of about 7.0–8.75 µm is used. They are cheaper and need no cooling, so they are suitable for continuous operation over many years, but they have lower sensitivity: in one comparison the detection limit (NECL) at a temperature difference of 10 K was 14 ppm·m for a cooled camera and 105 ppm·m for an uncooled one.
For gases absorbing in the range of about 10 µm the situation is the opposite. According to a study based on the HITRAN spectral database, sulphur hexafluoride (SF₆) has a single peak at 10.57 µm, and ammonia (NH₃) peaks at 10.35 and 10.73 µm. For these gases you need cameras tuned to the long-wave band around 10.3–10.7 µm, not a typical "methane" camera.
What determines whether the plume is visible
The camera does not see the gas, only the contrast. Several factors affect contrast:
- The temperature difference between the gas and the background (ΔT). When the gas is at the temperature of the background (ΔT close to zero), the contrast vanishes. Studies indicate that gas warmer than the background is easier to see than gas colder than it, and that the best background is cold, clear sky. Appendix K (clause 6.1.2) requires that the camera produce a detectable image of a methane emission of 19 g/h (and of n-butane 29 g/h or propane 22 g/h) from a distance of 2.0 m at ΔT = 5.0 °C and calm wind (about 1 m/s or less); this is a camera specification requirement confirmed once, not a guarantee of detecting such a leak in the field.
- The background. A uniform, solid background (concrete, a wall) favours detection. Dense vegetation, glare and reflections make it harder, and in an experimental study several releases could not be quantified at all because of cloud cover or weeds in the background.
- Distance. According to a 2017 model this is the most important parameter: from 10 m more than 80% of emissions can be detected at the simulated location, but the detection limit rises quickly with distance (a power-law relationship).
- Wind. Strong wind dilutes and stretches the plume before it can form a clear image. That is why the reference conditions in protocols (e.g. Appendix K) assume wind of about 1 m/s or less, and in the QOGI study the results were better in very light wind.
- Humidity and other gases in the air. Water vapour absorbs infrared in part of the range and disturbs detection in broadband cameras, and strongly absorbing gases (ammonia, propylene) can "saturate" the absorption, which makes it harder to estimate the quantity.
- Gas composition. The image is formed by methane (and other hydrocarbons). Biogas usually contains about 50–65% methane, the remainder being CO₂, so the plume is weaker than with pure natural gas. In the 2017 model the detection limit was lower for gas containing a significant fraction of heavier hydrocarbons.
Which gases can be seen
The choice of camera determines which gases you will see. The table below sets out the most important cases; for each device check the band in its documentation.
| Gas | Absorption band | Typical camera | Notes |
|---|---|---|---|
| Methane (CH₄) | 3.2–3.55 µm; also 7.2–8.3 µm (peak at about 7.5 µm) | cooled MWIR (most sensitive); uncooled LWIR with filter (less sensitive) | the main target at biogas plants |
| VOCs and other hydrocarbons | common C–H band at about 3.2–3.55 µm | cooled MWIR | ethane, propane, fuel vapours; the range depends on the molecule |
| SF₆ | peak at 10.57 µm | LWIR with a filter at about 10.6 µm | electrical switchgear |
| Ammonia (NH₃) | peaks at 10.35 and 10.73 µm | LWIR with a filter at about 10.5 µm | refrigeration, fertilisers |
| CO₂, CO | indicatively about 4.3 µm (CO₂) and about 4.6 µm (CO), according to spectroscopic data (e.g. HITRAN) | special MWIR cameras with a different filter | not the same camera as for methane; at a biogas plant CO₂ is usually not an OGI target |
| Refrigerants (HFCs) | usually the long-wave range (indicative, depending on the substance) | LWIR, depending on the substance | check the spectrum of the specific refrigerant in a spectral database or with the camera manufacturer |
| Hydrogen, nitrogen, oxygen | no infrared absorption (diatomic molecules of identical atoms) | cannot be detected by OGI | hydrogen requires point sensors |
| Hydrogen sulphide (H₂S) | not a typical OGI target (in practice it is monitored with sensors) | electrochemical sensors | a toxic hazard, not an imaging one |
Two practical remarks. First, at a biogas plant a "methane" camera also shows other hydrocarbons, but it will not show CO₂ (a different band); hydrogen sulphide is usually monitored with sensors. Second, visibility depends on the amount of gas in the field of view (concentration times path length, ppm·m), not on the concentration at the source alone.
Types of OGI systems
Handheld cooled cameras are the standard for LDAR surveys. The operator walks around the installation with the camera and films potential sources, recording plumes together with their context. Cooled MWIR cameras offer the highest sensitivity and are chosen for precise localisation of a leak.
Uncooled cameras are cheaper and more durable, and their sensitivity to methane is lower. They work well in fixed installations because they need no detector cooler and, according to the review paper, can operate 24/7 for years.
Fixed systems (continuous monitoring) are cameras on a mast or wall, looking at a chosen part of the installation: a tank, a pressure reduction station, a flare. They detect leaks as they happen (e.g. gas released through a valve), not once a year, and can send an alarm. However, they require the field of view to be set up well and are limited to the observed area.
Drones with an OGI camera make it possible to survey large areas (a landfill, a lagoon, an extensive biogas plant) and hard-to-reach places. The payload is sometimes a cooled MWIR camera. They are limited by weather (wind, rain), aviation law, equipment weight and the fact that from a position above the site the background (ground) is often less favourable than the sky. Modelling from 2017 indicates that detection against a sky background or at low emissivity is more effective than from above.
Quantitative OGI (QOGI) and its limitations
An ordinary OGI camera answers the question "where?". The quantitative variant (QOGI) tries to answer "how much?" as well. Software calculates for each pixel of the plume the so-called path-integrated concentration (ppm·m) on the basis of contrast against the background and estimates the leak flow rate, taking wind speed into account.
The results of controlled studies are promising but conservative. In a single-blind test, 357 measurements for releases of 0.1–2.9 kg CH₄/h gave the following picture: 75% of measurements were within a factor of 3 of the true value (error from −67% to +200%), and individual errors ranged from −90% to +831%. Accuracy increased with leak rate, with a clear sky as the background and with very light wind (≤1 mph, i.e. about 0.45 m/s), and averaging over several camera positions narrowed the error. QOGI is therefore treated as an order-of-magnitude estimate for prioritising repairs, not as a billing-grade measurement.
What OGI cannot do
- It does not give concentration or flow rate without QOGI. You can see a plume, but you do not know whether 5 g/h or 500 g/h is escaping.
- It misses small leaks in poor conditions. In 2018 tests the median detection limit (50% probability) for a popular camera was about 20 g CH₄/h from a distance of 6 m, which according to the authors is an order of magnitude more than earlier estimates. Detectability falls as a power law with distance.
- It does not see gases with no absorption band in the camera's range (hydrogen, nitrogen, oxygen; CO₂ and H₂S with a methane camera).
- It depends on weather conditions and background. With a small ΔT, strong wind or a complex background the risk of missing a leak rises.
- It does not replace human judgement. Interpreting the image (water vapour, warm air from a chimney, movements of dust) requires experience.
The authors of the 2018 study link these results to emission-reduction policy: they point out that the marginal benefit of periodic surveys assessed under real conditions decreases as detection sensitivity improves. For practice a cautious conclusion can be drawn from this (our interpretation): detecting large leaks is more important than chasing every gram.
OGI compared with other methods
| Method | What it gives | Advantages | Limitations |
|---|---|---|---|
| OGI (camera) | location of leaks in the image | quick survey, from a distance, video | no concentration without QOGI, dependence on conditions |
| Portable detector (FID/PID/semiconductor) | concentration at the source (ppm) | cheap, simple, confirms a repair | point-by-point measurement, you have to get close |
| EPA Method 21 / sniffing (EN 15446) | concentration at the surface of a component, converted into emission | formally recognised, used in refineries | time-consuming, requires access to each component |
| Laser methane detectors (TDLAS) | concentration along the laser beam, often from a distance | sensitive, good for path monitoring | point or line measurement, not an image |
| Leak detection fluid | bubbles at a connection | very cheap | only accessible, pressurised connections |
| Whole-site measurements (tracer, mobile analysers with a dispersion model, lidar) | total emission from the site | take all sources into account | do not point to a specific component |
The best programme combines several of them: OGI for surveying and localisation, a detector or sniffing for confirmation and verification of the repair, and a whole-site measurement from time to time to check whether the sum of losses adds up. In Europe there are standards for fugitive VOC emissions: EN 15446 (measurement of concentration at the source and conversion into emission) and EN 17628 (methods for determining diffuse VOC emissions, including OGI, DIAL lidar and others).
Applications at a biogas plant and a biomethane plant
Measurements in various countries leave no illusions: leaks are real and measurable. In a study of 23 biogas plants (tracer method) losses were from 0.4% to 14.9% of methane production, 4.6% on average; at agricultural biogas plants 2.4% on average, and at wastewater treatment plants 7.5%. Emission rates ranged from 2.3 to 33.5 kg CH₄/h, and larger sites usually lost less.
OGI will not detect all of these losses (some are emissions from digestate storage and unburnt methane in exhaust gases), but it helps identify those that can be repaired straight away.
Typical leak locations
- The membrane roof of a digester or gas store: fixings, seams, penetrations, seals. In a study of two agricultural biogas plants, losses from leaks and venting at one site fell from 3.8% to 0.6% after the dome membrane was repaired.
- Pressure relief valves of gas holders: they open when gas pressure is too high. In measurements at two German agricultural biogas plants the loss through the valve was 0.06% at one installation and 3.6–3.9% at the other (452 activations in 66 days in the summer season), and the authors link the emissions mainly to the operating state of the plant and the availability of an automatic flare, as well as to atmospheric pressure.
- Fittings, flanges, seals of pumps and blowers, condensate drains on the gas installation.
- The flare: a leak at ignition and when the flame goes out (unburnt gas).
- Upgrading and injection stations: compression and drying systems, vents, control valves and fittings.
- Digestate storage: here OGI helps less, because emissions arise at the surface and are often diffuse. In a study of two agricultural biogas plants digestate storage was the largest source of losses (5.8% and 10.7%).
We describe the basics of methane losses and ways of reducing them in the guide Methane losses and fugitive emissions at a biogas plant; for an emergency action plan see the post Biogas plant emergency plan: leak, fire, overflow, power failure.
Other sites
- Landfills: inspection of degassing systems, wells, gas pipelines and surfaces; drones are useful for surveying a large area.
- Wastewater treatment plants: digesters, gas holders, gas installations.
- Gas networks and stations: flanges, valves, pressure reduction stations, biomethane injection points.
- LNG and bio-LNG: liquefaction plants, tanks, loading stations; the temperature difference between cold gas and the surroundings can favour contrast, but this depends on conditions.
- Refineries and the chemical industry: the classic field of OGI use in LDAR programmes (we explain this in the section on standards).
- Power engineering: SF₆ leaks from switchgear and circuit breakers, important because of the very high global warming potential of this gas.
- Refrigeration: ammonia installations and those using fluorinated refrigerants.
Benefits of implementation
1. Less lost methane and fewer emissions: how to calculate it
Methane is a product that you sell or burn in a CHP unit. Every loss is lost energy and an emission of a greenhouse gas. The calculation is simple:
Loss (m³ per year, CH₄/rok) = CH₄ production (m³/year) × share of losses (the share refers to the methane produced, not to all the biogas) Energy (MWh) = loss × about 9.97 kWh/m³ (lower heating value of methane at normal conditions) ÷ 1000 Mass (t CH₄) = loss × about 0.72 kg/m³ ÷ 1000 Emission (t CO₂e) = mass of CH₄ × GWP₁₀₀; 27.0 was assumed (IPCC AR6 WG1, ch. 7, table 7.15, non-fossil methane, because methane from biogas is of biogenic origin; for fossil methane, e.g. from natural gas, the table gives 29.8; the uncertainty of both values is ±11)
Illustrative example (hypothetical numbers, not data from any installation): a biogas plant produces 500 Nm³/h of biogas containing 55% methane and operates 8000 hours a year.
- Methane production: 500 × 0.55 × 8000 = 2,200,000 m³ per year (CH₄/rok).
- A loss of 1% of the methane produced: 22,000 m³ CH₄, i.e. about 219 MWh of energy and about 15.8 t of methane.
- At an illustratively assumed price of PLN 300/MWh this is about PLN 65,800 a year.
- Emission: 15.84 t × 27.0 = about 428 t CO₂e a year (at GWP₁₀₀ = 29.8 it would be about 472 t).
- A loss of 2.4% (the average for agricultural biogas plants from the study of 23 installations) is already about 526 MWh and about PLN 158,000 a year at the same assumed price.
- A single leak of 1 kg CH₄/h, unnoticed for a whole year, is about 8.76 t of methane, about 12,200 m³, about 121 MWh and about PLN 36,400 at the assumed price. By comparison, a leak at the OGI detection limit (20 g/h) amounts to only about 2.4 MWh over a year.
Conclusion: it pays to catch the large leaks, not the smallest ones, and an OGI survey usually pays for itself with a single detected and repaired "super-emitter". The price of energy, the value of certificates of origin or the cost of allowances depend on contracts, so use your own figures.
2. Safety
Biogas and biomethane form explosive mixtures with air. OGI makes it possible to check places that are inadvisable or inconvenient to enter from a distance, without putting your face close to a valve and without removing covers. The device itself in an explosion hazard zone must have appropriate approval, and the procedures for Ex zones still apply; if in doubt, check the camera documentation and the site instructions. Every leak found also reduces the risk of an explosive atmosphere forming.
3. Speed
The camera searches a site at walking pace. A measurement with a portable detector requires approaching each point separately, whereas a camera takes in many points at once. For large complexes (a biomethane plant with upgrading, a compressor room and an injection station) this is the difference between an inspection that takes place and one that is put off.
4. Documentation for the service provider, the insurer and the audit
A recording of the plume, its location, the date, weather conditions and confirmation of the repair create a trail that is useful to the service provider (what to repair), the insurer and the auditor (that the installation is maintained in proper condition) and the investor or financing bank.
5. Legal and contractual requirements
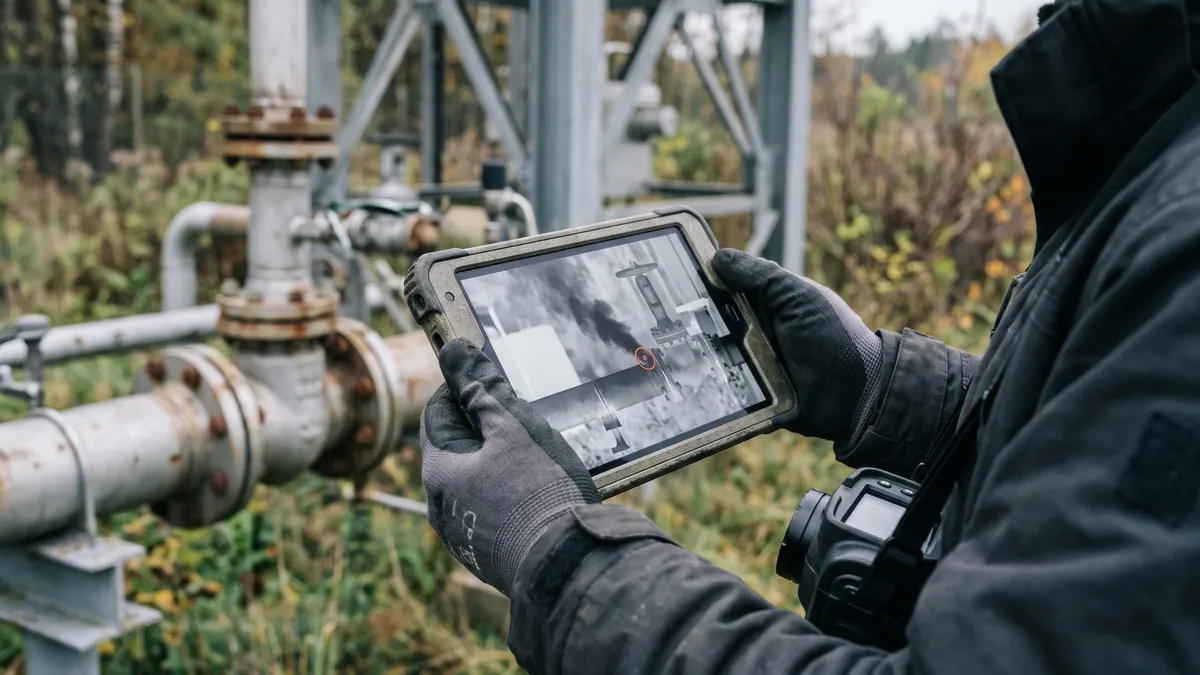
For most biogas plants in the EU an obligation to carry out an OGI survey does not follow directly from legislation (see below), but it may follow from a permit, an agreement with the off-taker or the grid operator, financing conditions or certification requirements.
Regulations and standards: an honest picture
Regulation (EU) 2024/1787 (the Methane Regulation)
The regulation entered into force in 2024. In accordance with Article 1(2) it applies to: exploration and production of oil and fossil gas and gathering and processing of fossil gas; closed and abandoned wells; transmission and distribution of natural gas (excluding metering systems at end customers), underground storage and LNG facilities; and coal mines. The words "biogas" and "biomethane" do not appear in the text of the act.
What follows from this for the industry:
- A biogas plant or biomethane plant as a producer: the regulation does not impose LDAR obligations on it directly. Whether and to what extent its requirements will cover the infrastructure elements linking the producer to the grid depends on the interpretation of the provisions and on the operator; if in doubt, it is worth asking the grid operator and a lawyer.
- Transmission, distribution, storage and LNG operators: yes, for them the regulation sets LDAR inspection schedules.
- Good practice: applying similar principles at a biogas plant is sensible and increasingly expected by financiers.
The most important LDAR rules of the regulation, for context:
- The operator submits an LDAR programme to the authorities by 5 May 2025 (existing sites; for new ones within 6 months of the start of operation), and carries out the first type 2 survey by 5 August 2025 at the latest.
- Two types of survey are distinguished. Type 1: repair of components emitting at least 7000 ppm or 17 g CH₄/h; type 2 (more sensitive): at least 500 ppm or 1 g CH₄/h for above-ground components (other thresholds apply to, among others, underground and offshore components).
- Repair is to take place immediately after detection; if that is not possible, the first attempt is made within 5 days at the latest, and completion within 30 days of detection.
- Minimum frequencies (Annex I): e.g. for regulating and metering stations and compressor stations type 1 every 4 months, type 2 every 8 months; for valve stations every 9 and 18 months respectively. For networks with a design pressure of up to 16 bar (type 2) these are 9 months for regulating and metering stations and 21 months for valve stations; for other components type 1 every 6 months, type 2 every 12 months.
- The regulation does not name OGI; it requires the use of best available technologies in line with the manufacturer's specification, and advanced technologies require approval by the authority within the LDAR programme. The Commission was to specify the details (detection limits and techniques) in an implementing act and in standards; check their current status.
We write about the regulation in more detail in the post EU Methane Regulation 2024/1787: obligations for the energy and biogas sector.
EN 17628 and EN 15446
EN 17628:2022 (CEN/TC 264) sets out methods for determining diffuse VOC emissions from industrial plants, including petrochemicals and refineries, and covers, besides OGI, also DIAL lidar, SOF, tracer correlation and inverse (dispersion) modelling. According to descriptions in standards catalogues, the methods were validated at onshore sites (petrochemicals, refining, the chemical industry, natural gas processing and storage), mainly for non-methane VOCs; the standard does not settle its application at a biogas plant. It is complemented by EN 15446, which describes measurement of concentration at the source and conversion into emission for individual components (valves, flanges, seals). Both concern VOCs in industry, not biogas plants as such, but they are a reference point for working practices.
BAT/BREF
In the BAT conclusions for the refining of mineral oil and gas (decision 2014/738/EU), technique BAT 6 recommends monitoring of diffuse VOCs from the whole installation using: sniffing methods with correlation curves, OGI techniques and periodically validated calculations from emission factors; DIAL and SOF serve as a supplement. This is one of the strong proofs that OGI is a recognised technique and not a novelty.
USA: EPA OOOOa/OOOOb and Appendix K as a reference point
In the USA the EPA rules for the oil and gas sector (NSPS OOOOb, effective from 7 May 2024) provide for periodic OGI surveys: semi-annual for multi-well sites, quarterly for larger production facilities and compressor stations (plus AVO sensory inspections, monthly at compressor stations) and annual for the Alaska North Slope. Appendix K is the technical OGI protocol (requirements for the camera, operator training and audit, the so-called operating envelope); it is applied where a specific provision refers to it. It is not a method for measuring leak rate. The rules listed are only a reference point; they do not apply in the EU.
Biomethane, certification and carbon footprint
In the greenhouse gas emission reduction methodology of RED II (Directive 2018/2001, Annex VI) the default values for biomethane distinguish, among other things, open and closed digestate and the combustion of off-gas from upgrading. Closed storage means a gas-tight tank from which biogas is recovered, and no additional emission is assigned to it. The effect of methane losses on the result for a specific installation is therefore calculated using the GHG methodology; well-documented low losses make it easier to defend the result. We do not claim that certification schemes require OGI; check the requirements of your chosen scheme (e.g. ISCC or REDcert) and of your certification body. We describe the methodology in the post GHG emission reduction in RED II: thresholds, default values, calculations.
An LDAR survey with OGI step by step
- Preparation and inventory. List the potential leak points (valves, flanges, penetrations, tanks, safety valves, flare) and number them. Plan the route.
- Conditions. Choose a day with light wind, good contrast (the sun should not shine straight into the lens) and as clean a background as possible. Note the temperature, wind and cloud cover.
- Camera verification. Check that the camera works and its range (the filter for methane); pay attention to calibration messages.
- Scanning. Walk through the installation, filming each point from several angles and from a distance appropriate for the camera and the object. For tank roofs, look at various angles against the background.
- Confirmation. Record a detected plume, locate the source and, if needed, check with a portable detector (concentration at the source). Distinguish a leak from water vapour and warm air.
- Classification. Assign a priority (large/small leak, safety risk, value of losses).
- Repair. Set a deadline: the Methane Regulation requires its addressees to repair immediately or attempt within 5 days and complete within 30 days; for biogas plants we recommend the same scheme as a model (a recommendation, not a legal requirement). Use safe procedures for the repair (emptying to the flare instead of to the atmosphere).
- Verification after repair. Repeat the check with OGI or a detector and record the result.
- Report. Record: the date, conditions, list of points, photos/video, results, repairs, deadlines and responsible persons.
How often
EU legislation does not set an interval for biogas plants. The editorial recommendation (not a requirement and not a research result) is the following scheme: a full survey once a year, checks of critical points (membranes, safety valves, flare) more often, e.g. quarterly or after failures and overhauls, and an immediate check after signs of a gas balance mismatch. For regulating and metering stations covered by the Methane Regulation the intervals mentioned above apply. The frequency is best set on the basis of a risk analysis and the first results.
Who can carry it out and how to train
A survey can be carried out by your own employee or by a service company. We are not aware of a national provision that would require a separate licence to operate an OGI camera (we have not carried out a full review of the law, so if in doubt ask a lawyer or the authority), but the reliability of the results depends on training. Manufacturers and training centres offer courses in operating cameras and interpreting images (offered by, among others, equipment manufacturers and independent centres), and the qualifications of thermography personnel are described by ISO 18436-7 (it concerns thermography in general, not OGI). The EPA Appendix K protocol describes the training and audit of OGI operators, which is a useful model for your own procedures. We also recommend that the operator know the specifics of a biogas plant (Ex zones, gas installations).
The choice between your own equipment and a service, and information about the market, are discussed separately: OGI technologies and solutions, OGI manufacturers and distribution in Poland and OGI: implementation, purchase or service.
Documentation
A good inspection record contains: the point identifier, the recording, time and place, weather conditions, camera type and settings, the result of confirmation (if there was one), the assigned repair, the date of repair and the result of the re-check. Such records make conversations with the insurer and the auditor easier and let you see whether the number of leaks falls from year to year.
Summary
OGI is not a miracle device but a proven tool: it lets you quickly find large methane leaks, document them and repair them before they cost thousands of zlotys a year. Its limitations (no concentration, sensitivity to conditions, no visibility of some gases) must be known and compensated for with other methods. At a biogas plant the greatest contribution will come from the roof and membranes, safety valves, the flare and the upgrading station, and the legal obligation stems rather from contracts and financing than from the Methane Regulation, which concerns primarily fossil fuels and natural gas infrastructure.
This text is for information only and does not constitute legal or technical advice. Before an investment or formal decision, check the current wording of the regulations and the requirements of your grid operator, authority and certification scheme. The images in the article are illustrative images generated by AI, not real recordings.
Sources
- Rozporządzenie (UE) 2024/1787 w sprawie redukcji emisji metanu w sektorze energetycznym — EUR-Lex
- Jobert et al., Optical Gas Imaging with Cooled and Uncooled Thermal Infrared Cameras, Sensors 2026
- Li et al., Chemical Gas Telemetry System Based on Multispectral Infrared Imaging, Toxics 2023
- Hagen, Real-Time Quantification of Gas Leaks Using a Snapshot Infrared Spectral Imager, Sensors 2025
- Ravikumar, Wang, Brandt, Are Optical Gas Imaging Technologies Effective For Methane Leak Detection?, Environ. Sci. Technol. 2017
- Ravikumar et al., „Good versus Good Enough?” Empirical Tests of Methane Leak Detection Sensitivity of a Commercial Infrared Camera, Environ. Sci. Technol. 2018
- Ilonze, Wang, Ravikumar, Zimmerle, Methane Quantification Performance of the Quantitative Optical Gas Imaging (QOGI) System Using Single-Blind Controlled Release Assessment, Sensors 2024
- Scheutz, Fredenslund, Total methane emission rates and losses from 23 biogas plants, Waste Management 2019
- Baldé, Wagner-Riddle, MacDonald, VanderZaag, Fugitive methane emissions from two agricultural biogas plants, Waste Management 2022
- Reinelt, Liebetrau, Nelles, Analysis of operational methane emissions from pressure relief valves from biogas storages of biogas plants, Bioresource Technology 2016
- Decyzja wykonawcza Komisji 2014/738/UE — konkluzje BAT dla rafinacji ropy naftowej i gazu — EUR-Lex
- Dyrektywa (UE) 2018/2001 (RED II), załącznik VI — EUR-Lex
- US EPA, NSPS OOOOb i EG OOOOc — Federal Register, 8 marca 2024
- US EPA, Appendix K do 40 CFR Part 60 (OGI) — eCFR
- EN 17628:2022 — Fugitive and diffuse emissions of common concern to industry sectors: standard method to determine diffuse emissions of VOCs into the atmosphere (katalog SIS)
- ISO 18436-7:2014 — kwalifikacje personelu termografii
- IPCC AR6 WG1, rozdział 7, tab. 7.15 (GWP-100 metanu: 29,8 ± 11 dla pochodzenia kopalnego, 27,0 ± 11 dla niekopalnego)
- Gordon et al., The HITRAN2020 molecular spectroscopic database, J. Quant. Spectrosc. Radiat. Transf. 2022
Questions and answers
Are qualifications needed to operate an OGI camera?
We are not aware of a national provision that would require a separate licence for this. The operator should, however, complete training in operating the OGI camera and interpreting the image, and in explosion-hazard zones use equipment and procedures consistent with the facility's safety rules. In the USA, the EPA Appendix K protocol explicitly describes training requirements for operators.
Does EU methane regulation 2024/1787 require OGI at biogas plants?
No. The regulation covers oil, fossil gas, natural gas transmission and distribution, storage, LNG installations and coal mines; the words biogas and biomethane do not appear in its text, nor does it name OGI cameras as the only technology. For biogas plants it is good practice and a requirement arising at most from contracts, financing or permits.
Does OGI give the quantity of escaping methane?
A standard OGI camera shows where a leak is, but does not measure its rate. Quantitative OGI (QOGI) estimates the rate in kg CH₄/h, but in a field study 75% of measurements fell within a range from −67% to +200% relative to the actual value.
Does OGI replace portable detectors and the sniffing method?
No, it complements them. OGI quickly scans many points and shows a leak from a distance, while a portable detector or EPA Method 21 (sniffing) measures the concentration at the source and helps confirm the repair.
How much can be saved by detecting methane leaks?
It depends on the scale of the installation. In an example biogas plant (illustrative assumptions, 2.2 million m³ CH₄ a year) every 1% loss of the methane produced is approx. 22,000 m³, that is, about 219 MWh of energy and approx. 428 t CO₂e a year. The real value is calculated from your own data and your own energy price.
How often should an OGI survey be carried out at a biogas plant?
No EU rule sets a frequency for biogas plants. The editorial team's recommendation (not a requirement): a reasonable starting point is a survey of the whole installation once a year, an additional check after major overhauls and a quick verification after failures; for gas stations connected to the grid, however, the intervals from Regulation 2024/1787 apply (e.g. every 4 months for a type 1 survey or every 8 months for type 2 at pressure regulating and metering stations; details and exceptions in Annex I).
How does an OGI camera differ from an ordinary thermal imaging camera?
An ordinary thermal imager measures infrared radiation in a broad band and shows surface temperature. An OGI camera additionally has a spectral filter matched to the absorption band of the selected gas, so it shows not temperature but a gas cloud that absorbs background radiation.
When will an OGI camera not work?
When the temperature difference between the gas and the background is too small, in strong wind that dilutes the plume, at a large distance, against a complex background (vegetation, shiny surfaces) and with very small leaks. In tests of one commercial camera, the median detectability (50%) was approx. 20 g CH₄/h from a distance of 6 m.
Will an OGI camera see every gas at a biogas plant?
No. Only a gas that absorbs infrared in the camera's band is visible. Methane and other hydrocarbons can be seen with cameras tuned to the 3.2–3.55 µm band, whereas hydrogen, nitrogen and oxygen do not form an image at all. Hydrogen sulphide is usually detected with sensors, not with a camera.