

BMP testingFruit, vegetables and their residues
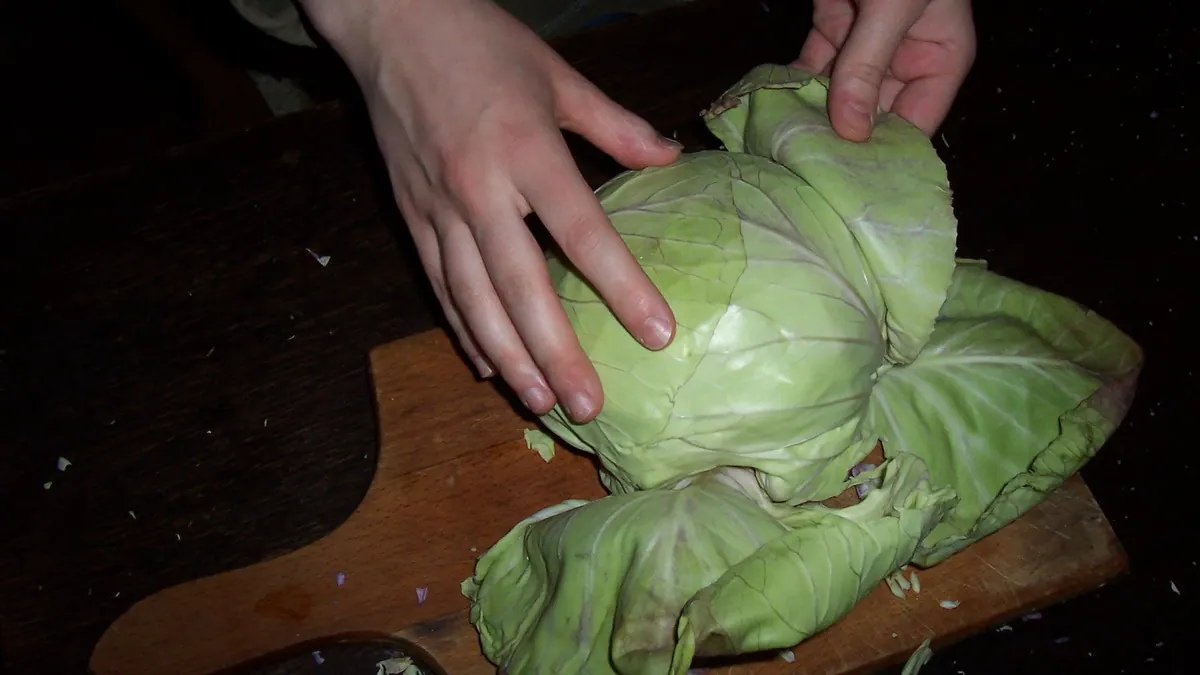
Cabbage outer leaves and stems — BMP: 5 studies, weighted mean 320 m³ CH₄/t VS
Outer cabbage leaves and cores are a typical waste from cleaning heads, rich in fibre and sulphur compounds, available seasonally in large batches.
Photo Nikola Smolenski / Wikimedia Commons, licence CC BY-SA 3.0, source file; changes: cropping

- Weighted mean
- 320m³ CH₄/t VS
- Range
- 291–382m³ CH₄/t VS
- Records
- 5studies
- Publications
- 3sources
- Temperatures
- 35 °Cof the test
Methane in biogas
High methane content · ≈ 6.7 kWh/m³ of biogas
measured mean of 2 studies BMP, range 67.2–67.9 %; in a batch test the CH₄ share tends to be higher than in a plant.
Rating for biogas plants
neutral — editorial rating for biogas plantsNo clear advantages — worth charging a fee for accepting it
Potential per tonne of fresh matter: moderate (33 m³ CH₄/t); process risk: acidification. Handling costs: fibres, floating layer.
Why? Rating factors
Potential per tonne +1
- +1potential 33 m³ CH₄/t fresh matter (BMP 320 × DM 11.4 % × VS 91.2 %)
Process stability −1
- −1acidification: rapid degradation / acidic pH, risk of VFA accumulation, needs buffering
Handling and costs −0.5
- −0.5fibres, floating layer — shredding and intensive mixing
Total points: −0.5 · thresholds: ≥ 2.5 very good, ≥ 1 good, below — neutral; negative with cumulative process risk.
Add to the co-digestion calculator CSV data
BMP curves from 5 studies
Weighted mean Individual records
Dashed lines are a model curve (first-order kinetics, B(t) = B₀·(1 − e−kt)); the end point comes from the publication. All curves are model curves.
Cumulative methane production over the test [m³ CH₄/t VS]. The thick line is the weighted mean of all records (320); dots mark the end values given in the publications. Point at the chart to read values; click a legend item to hide or show a record.
Records and sources
Download CSV| Source | BMP m³ CH₄/t VS | CH₄ in biogas % vol., measured | Temperature | Sample | Curve |
|---|---|---|---|---|---|
| Zubr (1986) · 1 DOI | 343 | 67.2 % | 35 °C · mesophilic | White cabbage · pretreatment: Silage: Air tight glass jars , fermented 30-40 days at 20 oC. | end point (model curve) |
| Zubr (1986) · 2 DOI | 382 | 67.9 % | 35 °C · mesophilic | White cabbage | end point (model curve) |
| Gunaseelan (2004) · 1 DOI | 291 | — | 35 °C · mesophilic | Cabbage stem | end point (model curve) |
| Gunaseelan (2004) · 2 DOI | 309 | — | 35 °C · mesophilic | Cabbage Leaves | end point (model curve) |
| Czubaszek et al. (2022) DOI | 298 | — | — | Cabbage leaves | end point (model curve) |
| Weighted mean | 320 | 67.6 % | arithmetic mean 325, SD 38 | ||
Typical composition
- Dry matter (DM)
- 11.4% (range 11.4–11.4)
- Volatile solids (VS)
- 91.2 % DM (range 78–91.8)
- C/N ratio
- 16
Median and range of the determinations reported in the publications behind this substrate's BMP records (read from: CROPGEN D4, MY-D); dry matter: 1 determination, volatile solids: 3 determinations. DM from a single determination – indicative value.
Sources: Zubr (1986); Gunaseelan (2004).
The composition of the raw material varies between batches — for plant calculations use an analysis of your own sample. The calculator inserts typical values automatically.
Process properties
Low confidence: the description is based on general characteristics of the substrate group, not on studies of this material. Treat it as a hint to be verified.
Advantages
- Methane yield in the compendium: median 309 (range 291-382) m³ CH₄/t VS, 5 records from 3 studies (weighted mean 320).
- Cabbage leaves were studied as a substrate in a work on pumpkin, apples and cabbage leaves (Czubaszek et al. (2022))
Co-digestion — what to combine it with, what to watch out for
- combines well
substrates: nitrogen-rich — e.g. Pig slurry, Poultry manure, Waste activated sludge (secondary sludge), Chlorella vulgaris, Nannochloropsis salina
A nitrogen-rich co-substrate balances the low C/N of fruit and vegetable waste (Bouallagui et al. 2009).[1]
Dosing
No source limits on the dose for this substrate.
Introduce gradually, starting with a small dose and monitoring the process (e.g. FOS/TAC, pH, gas composition).
Sources of the process data
- Improvement of fruit and vegetable waste anaerobic digestion performance and stability with co-substrates addition
- Methanogenic fermentation of fresh and ensiled plant materials
- Biochemical methane potential of fruits and vegetable solid waste feedstocks
- Methane Production Potential from Apple Pomace, Cabbage Leaves, Pumpkin Residue and Walnut Husks
- Effects of size and thermophilic pre-hydrolysis of banana peel during anaerobic digestion, and biomethanation potential of key tropical fruit wastes
- Effect of particle size on biogas generation from biomass residues
The co-digestion calculator will assess a specific mixture containing this substrate.
What it is and where it comes from
Outer leaves and cores of cabbage arise as waste in packing houses, in plants processing sauerkraut, frozen foods and salads, and also in the field. Where production is concentrated they form a large, homogeneous batch, which makes them an interesting addition to the feed of a biogas plant. Heads are described as a separate substrate.
Properties relevant to digestion
The outer leaves have a larger share of fibre and a smaller share of soluble sugars than the inside of the head, and the cores are more compact and less watery. Even so, the whole falls within the group of materials of low lignin and high moisture content. The protein content provides nitrogen, and sulphur compounds from brassicas convert to hydrogen sulphide. Risks are acidification at too rapid dosing and clogging of feeding systems by long fibres if the cores are not well size-reduced. Waste from the field may contain soil, and thus sand.
How to read the spread of results
The dataset contains several records from several sources, which studied white cabbage leaves, cores and leaves with no further description. The result therefore depends on which fraction it concerns: cores and leaves differ in composition. In addition, the variety, harvest date, moisture content, size reduction and also the inoculum matter. All the records come from mesophilic studies, which limits differences resulting from temperature, but does not eliminate methodological variability.
In biogas plant practice
Cabbage leaves and cores combine well with slurry and silage. They should be size-reduced and the dose spread over time, controlling volatile acids. The biogas desulphurisation system must be working, particularly in the season of large deliveries. The material spoils quickly, so use within a few days or ensiling is advisable. Waste from processing and trade is treated as waste, so its collection requires conformity with the scope of the installation's permits.
For stable operation of the installation, it is beneficial to introduce leaves and cores in equal daily portions instead of large one-off deliveries, because variability of deliveries is the main source of fluctuations in pH and hydrogen sulphide concentration in the cabbage season.
On farms that grow cabbage and at the same time operate a biogas plant, logistics are simple, because the waste can be introduced directly after harvest; in systems based on external deliveries, a contract specifying the quality and frequency of deliveries is crucial.
Methodology in brief
BMP is the amount of methane obtained from volatile solids (VS) in a batch test, given in m³ CH₄ per tonne of VS (numerically the same as NmL CH₄/g VS in the publications) and converted to normal conditions (0 °C, 101.325 kPa). The weighted mean gives each publication a total weight of 1, split equally between its results for the substrate — a paper testing twenty varieties does not outweigh a paper with a single sample. In inter-laboratory programmes the unit is the laboratory (total weight 1), and within it the weight of a test grows with the number of bottles (replicates). Results after pretreatment (e.g. thermal, chemical, enzymatic) are shown separately and are not included in the mean.
Solid lines are curves measured in the tests. Where a publication gives only the final result, we draw a first-order kinetic model, B(t) = B₀·(1 − e−kt): only the end point comes from the publication, and the shape of the curve serves purely as visualisation — do not read the production on a particular day from it. For this substrate k = 0.245 d−1 was assumed (median of rate constants k reported in the sources and/or fitted to the mean measured curves).
The statistics describe the spread of published results — a descriptive compilation, not a meta-analysis or a guarantee of plant yield.
Bibliography
- Zubr, J. (1986). Methanogenic fermentation of fresh and ensiled plant materials. Biomass 11(3), 159–171. DOI: 10.1016/0144-4565(86)90064-8 DOI
- Gunaseelan, V. (2004). Biochemical methane potential of fruits and vegetable solid waste feedstocks. Biomass and Bioenergy 26(4), 389–399. DOI: 10.1016/j.biombioe.2003.08.006 DOI
- Czubaszek, R.; Wysocka-Czubaszek, A.; Tyborowski, R. (2022). Methane Production Potential from Apple Pomace, Cabbage Leaves, Pumpkin Residue and Walnut Husks. Applied Sciences 12(12), 6128. DOI: 10.3390/app12126128 DOI
All sources of the site: bibliography.
Other substrates in the group “Fruit, vegetables and their residues”
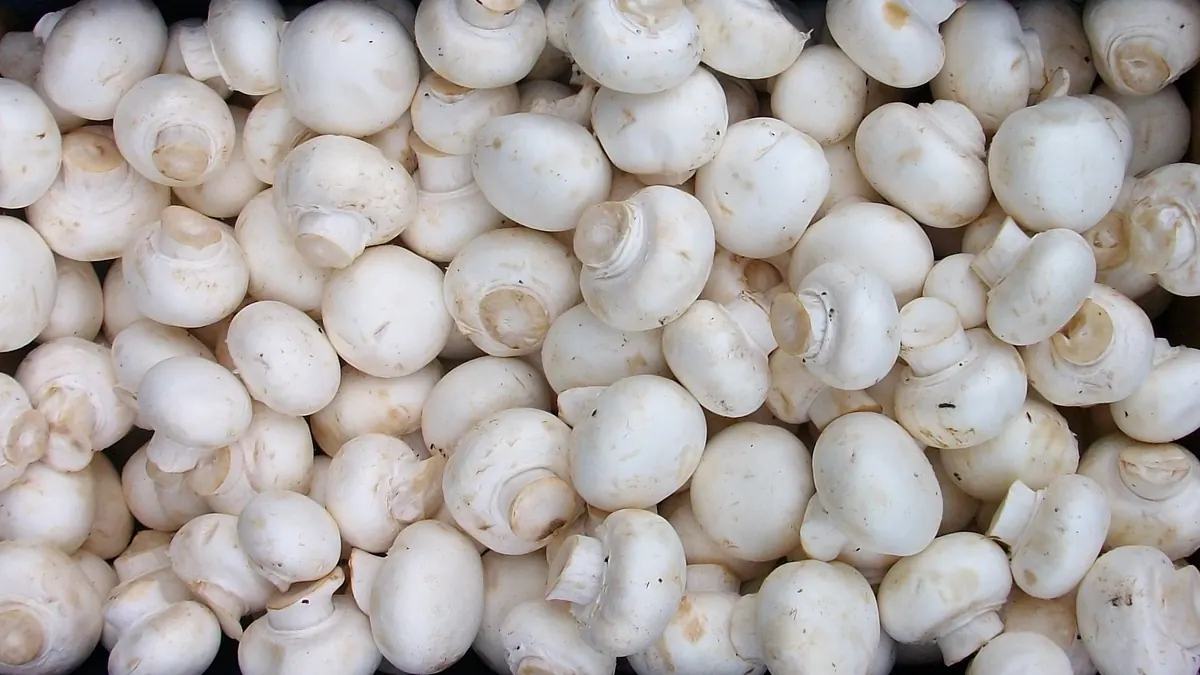
Mushroom fruiting bodies — BMP: 6 studies, weighted mean 345 m³ CH₄/t VS
345 m³ CH₄/t VS weighted mean from 6 studies
≈52 %
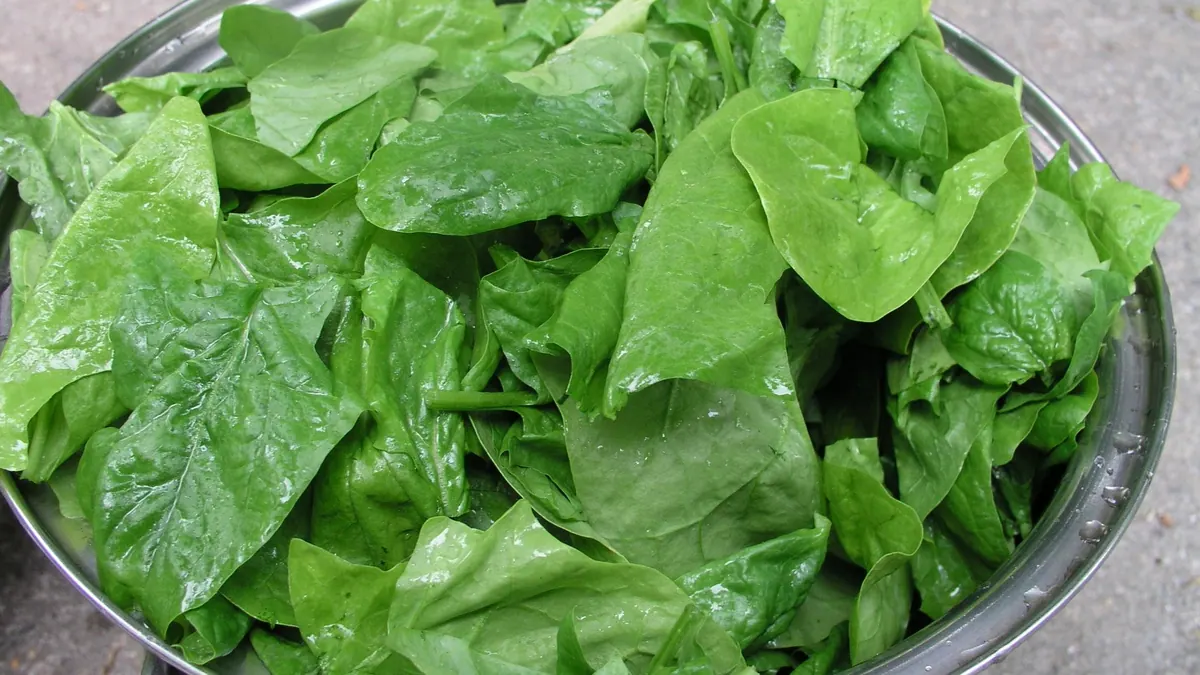
Spinach — BMP: 2 studies, weighted mean 227 m³ CH₄/t VS
227 m³ CH₄/t VS weighted mean from 2 studies
≈58 %
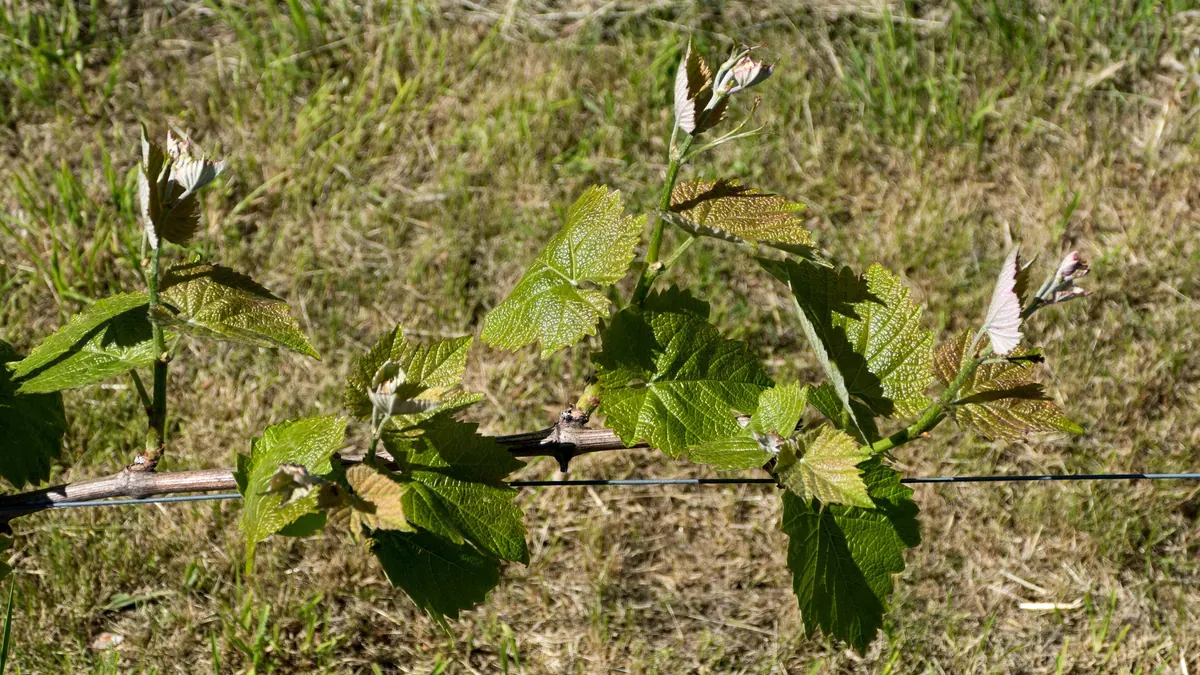
Grapevine leaves — BMP: 2 studies, weighted mean 292 m³ CH₄/t VS
292 m³ CH₄/t VS weighted mean from 2 studies
≈52 %
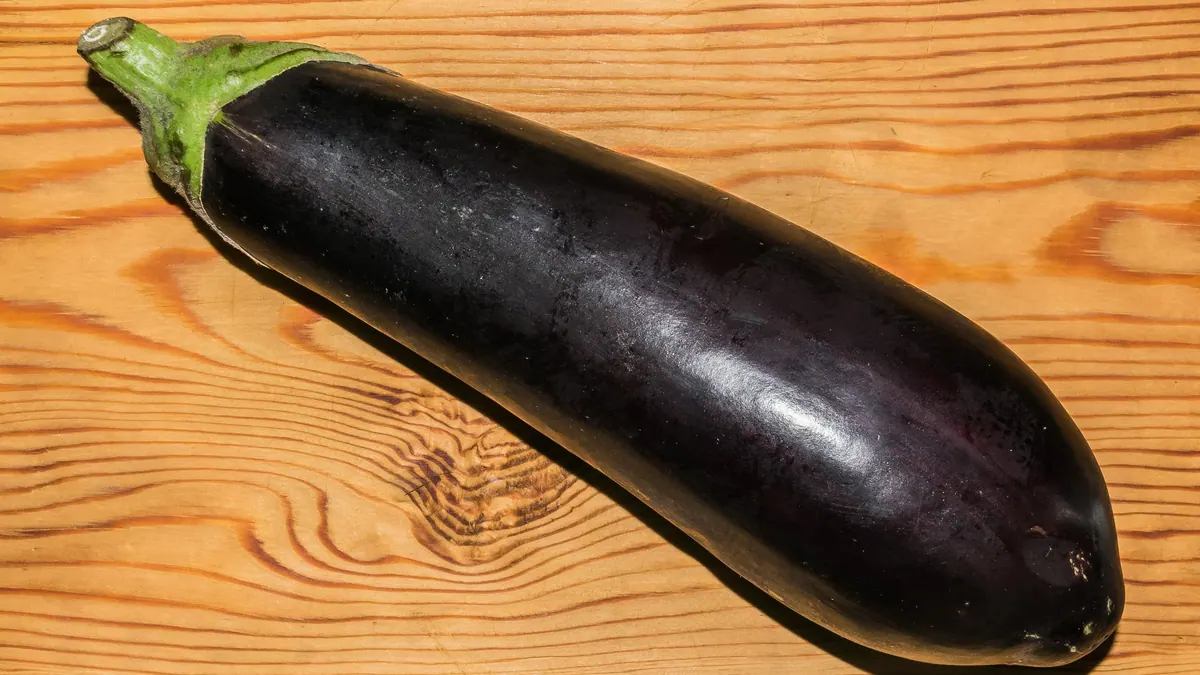
Eggplant (fruit) — BMP: 2 studies, weighted mean 333 m³ CH₄/t VS
333 m³ CH₄/t VS weighted mean from 2 studies
≈54 %