

BMP testingFruit, vegetables and their residuessingle study (2 samples)
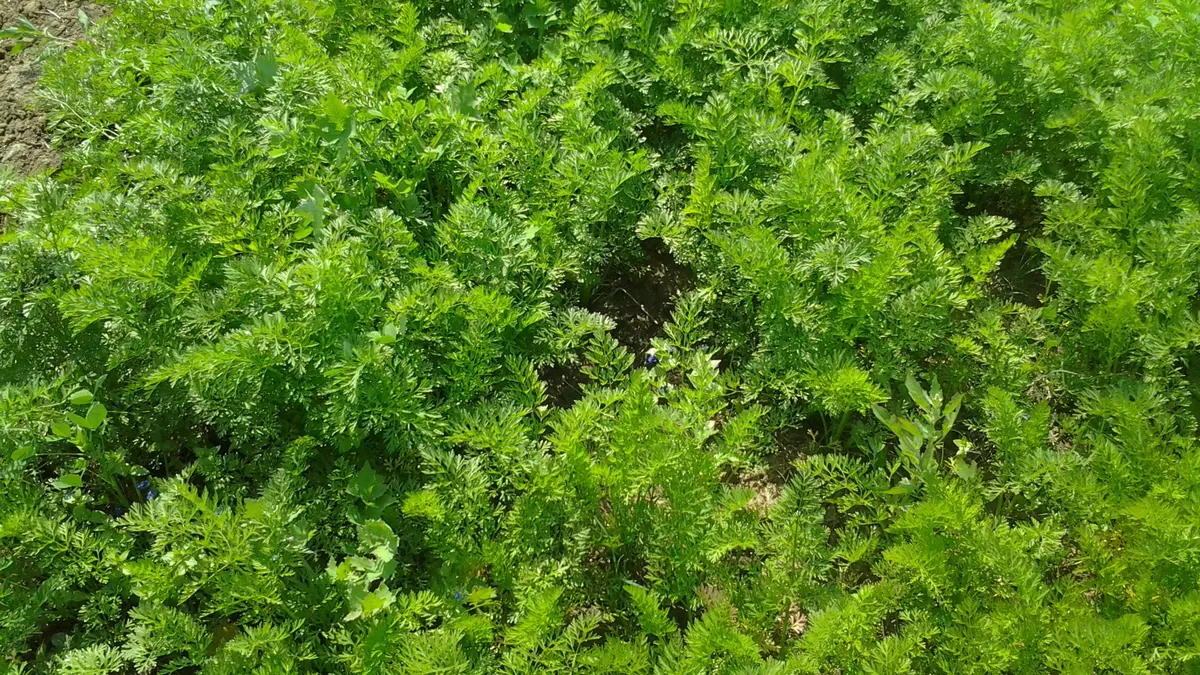
Carrot tops (leaves and petioles) — BMP: 2 studies, weighted mean 275 m³ CH₄/t VS
Carrot tops (leaves and petioles) are a post-harvest residue with a higher fibre content than the root, readily available in the field and in processing plants.
Photo Kumar gyan prakash / Wikimedia Commons, licence CC BY-SA 4.0, source file; changes: cropping

- Weighted mean
- 275m³ CH₄/t VS
- Range
- 241–309m³ CH₄/t VS
- Records
- 2single study (2 samples)
- Publications
- 1source
- Temperatures
- 35 °Cof the test
Methane in biogas
Medium methane content · ≈ 5.2 kWh/m³ of biogas
estimate from the substrate type The collected studies contain no measurement. The interval follows from the approximate composition (carbohydrate-dominated (no protein or fat characteristics)) and the yields of compound groups according to FNR.
Rating for biogas plants
not rated — editorial rating for biogas plants
Not rated: no dry matter or volatile solids in the data. We calculate the rating when the dry matter and volatile solids of the material are known.
Add to the co-digestion calculator CSV data
BMP curves from 2 studies
Weighted mean Individual records
Dashed lines are a model curve (first-order kinetics, B(t) = B₀·(1 − e−kt)); the end point comes from the publication. All curves are model curves.
Cumulative methane production over the test [m³ CH₄/t VS]. The thick line is the weighted mean of all records (275); dots mark the end values given in the publications. Point at the chart to read values; click a legend item to hide or show a record.
Records and sources
Download CSV| Source | BMP m³ CH₄/t VS | Temperature | Sample | Curve |
|---|---|---|---|---|
| Gunaseelan (2004) · 1 DOI | 241 | 35 °C · mesophilic | carrot Leaves | end point (model curve) |
| Gunaseelan (2004) · 2 DOI | 309 | 35 °C · mesophilic | carrot petiole | end point (model curve) |
| Weighted mean | 275 | arithmetic mean 275, SD 48 | ||
Typical composition
- Volatile solids (VS)
- 92.2 % DM (range 91.3–93.1)
Median and range of the determinations reported in the publications behind this substrate's BMP records (read from: MY-D); dry matter: 0 determinations, volatile solids: 2 determinations. No DM in the sources – the calculator has to ask for a value.
Sources: Gunaseelan (2004).
The composition of the raw material varies between batches — for plant calculations use an analysis of your own sample. The calculator inserts typical values automatically.
Process properties
Low confidence: the description is based on general characteristics of the substrate group, not on studies of this material. Treat it as a hint to be verified.
No published process studies
The literature we use does not describe the advantages or drawbacks of digesting this substrate beyond the BMP test results. Below are process characteristics assigned on the basis of the type of material — an editorial classification, not a study result.
- dilutes the feed (low DM)
- low dry matter, dilutes the feed
- seasonal
- seasonal availability — requires storage
- poor in trace elements
- poor in trace elements — mono-digestion requires supplementation
- variable composition
- high variability of composition between batches
- fibrous
- lignocellulose, long fibres → floating layer, harder mixing, slow degradation
Co-digestion — what to combine it with, what to watch out for
- combines well
substrates: nitrogen-rich — e.g. Pig slurry, Poultry manure, Waste activated sludge (secondary sludge), Chlorella vulgaris, Nannochloropsis salina
A nitrogen-rich co-substrate balances the low C/N of fruit and vegetable waste (Bouallagui et al. 2009).[1]
Dosing
No source limits on the dose for this substrate.
Sources of the process data
- Improvement of fruit and vegetable waste anaerobic digestion performance and stability with co-substrates addition
- Biochemical methane potential of fruits and vegetable solid waste feedstocks
- Effects of size and thermophilic pre-hydrolysis of banana peel during anaerobic digestion, and biomethanation potential of key tropical fruit wastes
- Effect of particle size on biogas generation from biomass residues
The co-digestion calculator will assess a specific mixture containing this substrate.
What it is and where it comes from
Carrot tops are the above-ground part of the plant: leaves and petioles. In large-scale cultivation they usually stay in the field after mechanical harvest, but in bunched-carrot crops and in packing houses handling young carrots they are separated from the roots and treated as waste. The dataset describes leaves and petioles, while the roots are covered in a separate substrate.
Properties relevant to digestion
Green tops contain a lot of water, and in the dry matter fibre (cellulose, hemicellulose), protein and soluble sugars predominate. Petioles are more fibrous than leaf blades, with a greater share of supporting structures. Lignin is moderate and increases with the age of the plant. The tops also contain volatile and phenolic compounds, but these are not a significant inhibitor at typical doses. The leaf protein supplies nitrogen, so the C/N ratio is lower than in woody materials. A significant risk is soil contamination after harvest, which translates into sand in the digester, and the rapid spoilage of fresh matter.
How to read the spread of results
The dataset contains several records from a single study: leaves and petioles, all under mesophilic conditions. The differences between them indicate that the share of the fraction in the batch matters for the result. The result also depends on the harvest date, the age of the leaves, comminution, the method of preservation (fresh, dried) and the inoculum. Because there is a single source, repeatability between laboratories cannot be assessed.
In biogas plant practice
Carrot tops can supplement the feed during the harvest season, especially on farms that grow vegetables themselves. They require shredding and, in larger quantities, ensiling, because fresh matter quickly loses its value. They combine well with slurry, which compensates for the low buffer content of the leaves. With mechanical feeding, care must be taken with fibres that wrap around agitators. Vegetable waste from outside the farm is subject to waste legislation, whereas residues from the farm's own field are used under the rules for agricultural products.
An additional advantage is that carrot tops appear at the same time as the roots, so both materials can be dosed together: the roots supply readily available sugars, and the tops fibre and protein, which evens out the course of digestion.
Methodology in brief
BMP is the amount of methane obtained from volatile solids (VS) in a batch test, given in m³ CH₄ per tonne of VS (numerically the same as NmL CH₄/g VS in the publications) and converted to normal conditions (0 °C, 101.325 kPa). The weighted mean gives each publication a total weight of 1, split equally between its results for the substrate — a paper testing twenty varieties does not outweigh a paper with a single sample. In inter-laboratory programmes the unit is the laboratory (total weight 1), and within it the weight of a test grows with the number of bottles (replicates). Results after pretreatment (e.g. thermal, chemical, enzymatic) are shown separately and are not included in the mean.
Solid lines are curves measured in the tests. Where a publication gives only the final result, we draw a first-order kinetic model, B(t) = B₀·(1 − e−kt): only the end point comes from the publication, and the shape of the curve serves purely as visualisation — do not read the production on a particular day from it. For this substrate k = 0.245 d−1 was assumed (median of rate constants k reported in the sources and/or fitted to the mean measured curves).
The statistics describe the spread of published results — a descriptive compilation, not a meta-analysis or a guarantee of plant yield.
Bibliography
- Gunaseelan, V. (2004). Biochemical methane potential of fruits and vegetable solid waste feedstocks. Biomass and Bioenergy 26(4), 389–399. DOI: 10.1016/j.biombioe.2003.08.006 DOI
All sources of the site: bibliography.
Other substrates in the group “Fruit, vegetables and their residues”
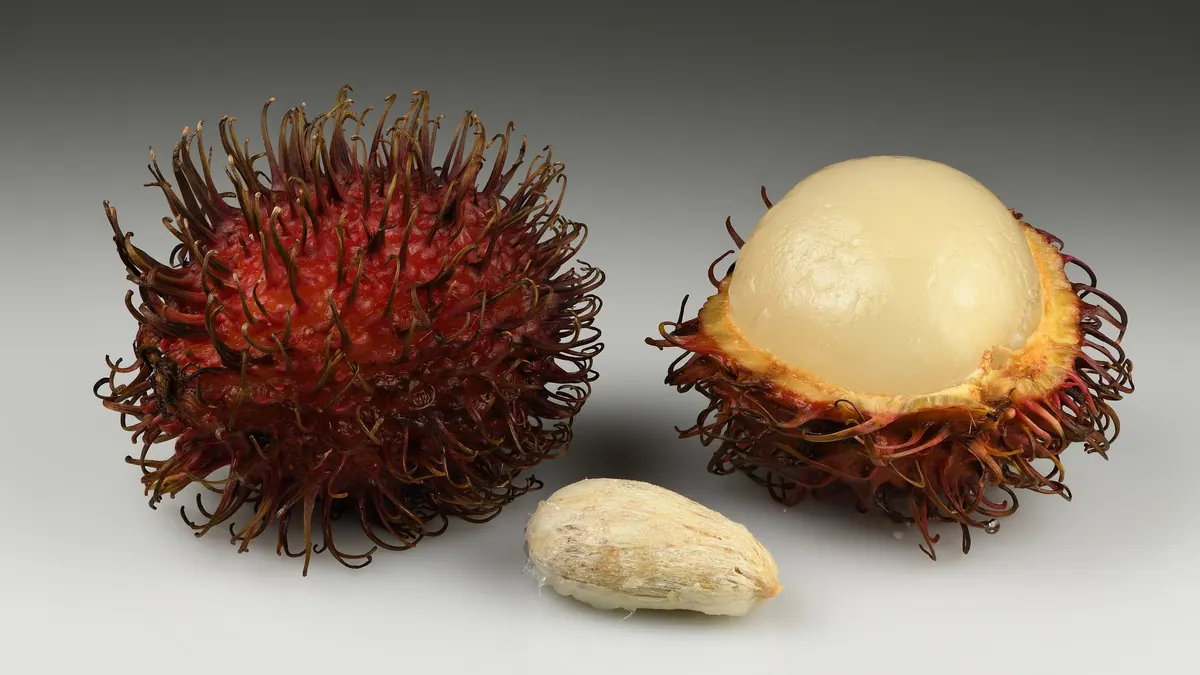
Rambutan seeds — BMP: 3 studies, weighted mean 449 m³ CH₄/t VS
449 m³ CH₄/t VS weighted mean from 3 studies
good — editorial rating for biogas plants≈52 %
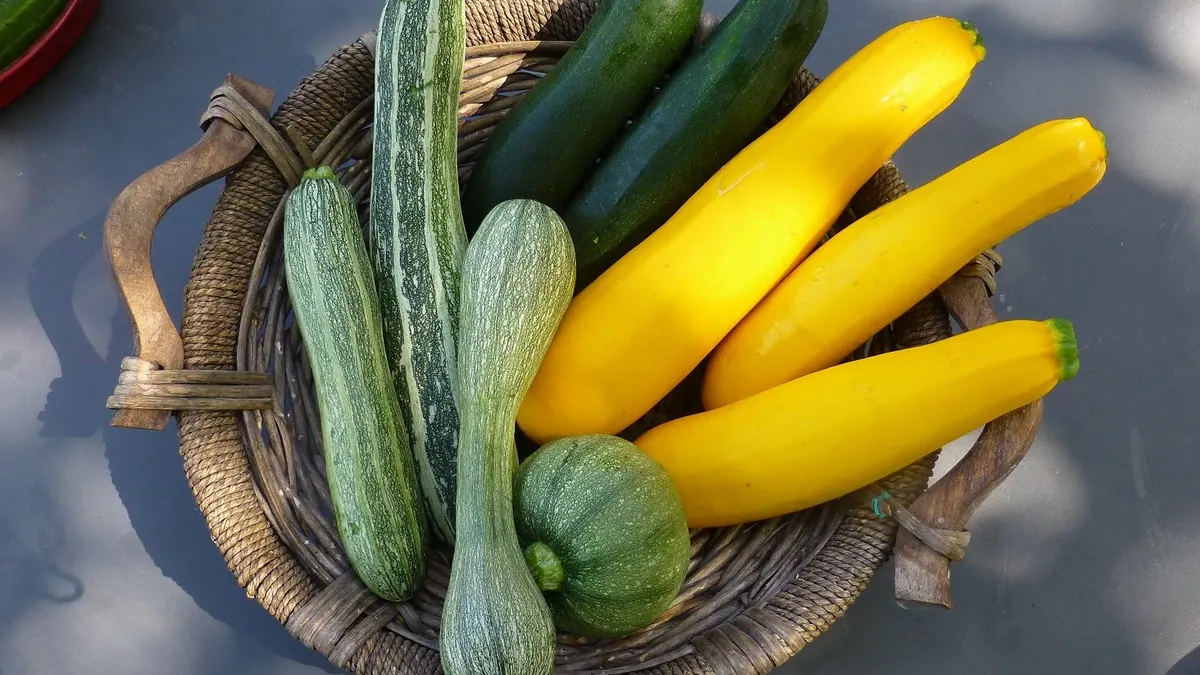
Zucchini and vegetable marrow — BMP: 4 studies, weighted mean 309 m³ CH₄/t VS
309 m³ CH₄/t VS weighted mean from 4 studies
≈52 %
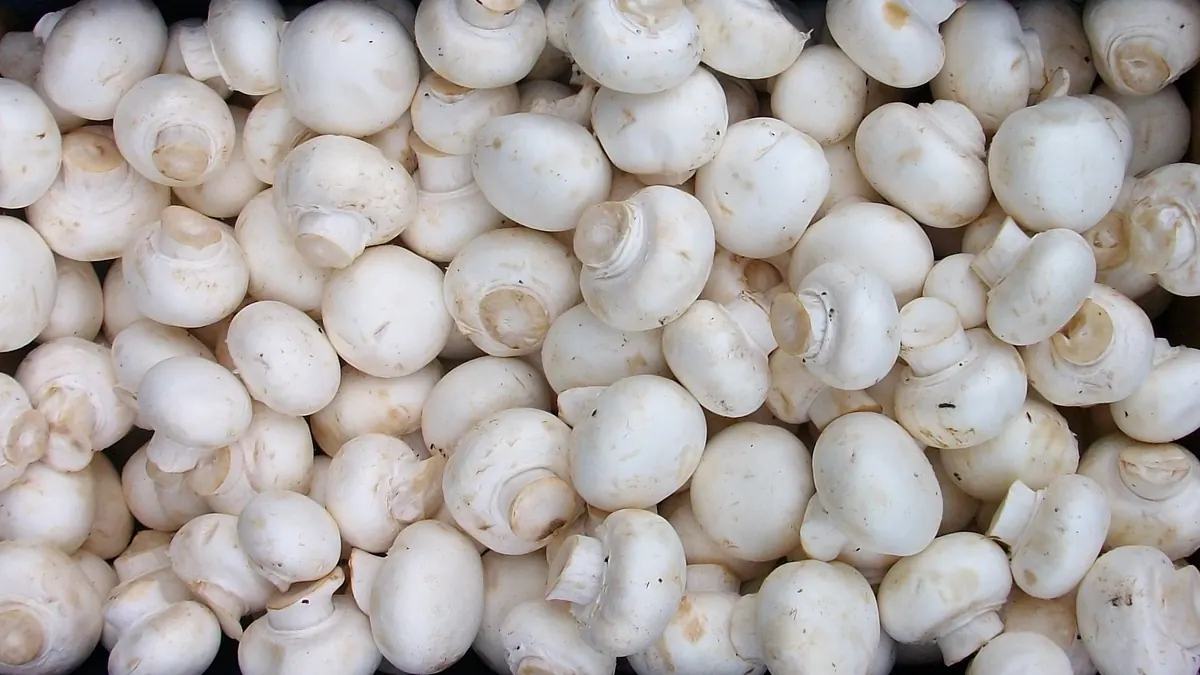
Mushroom fruiting bodies — BMP: 6 studies, weighted mean 345 m³ CH₄/t VS
345 m³ CH₄/t VS weighted mean from 6 studies
≈52 %
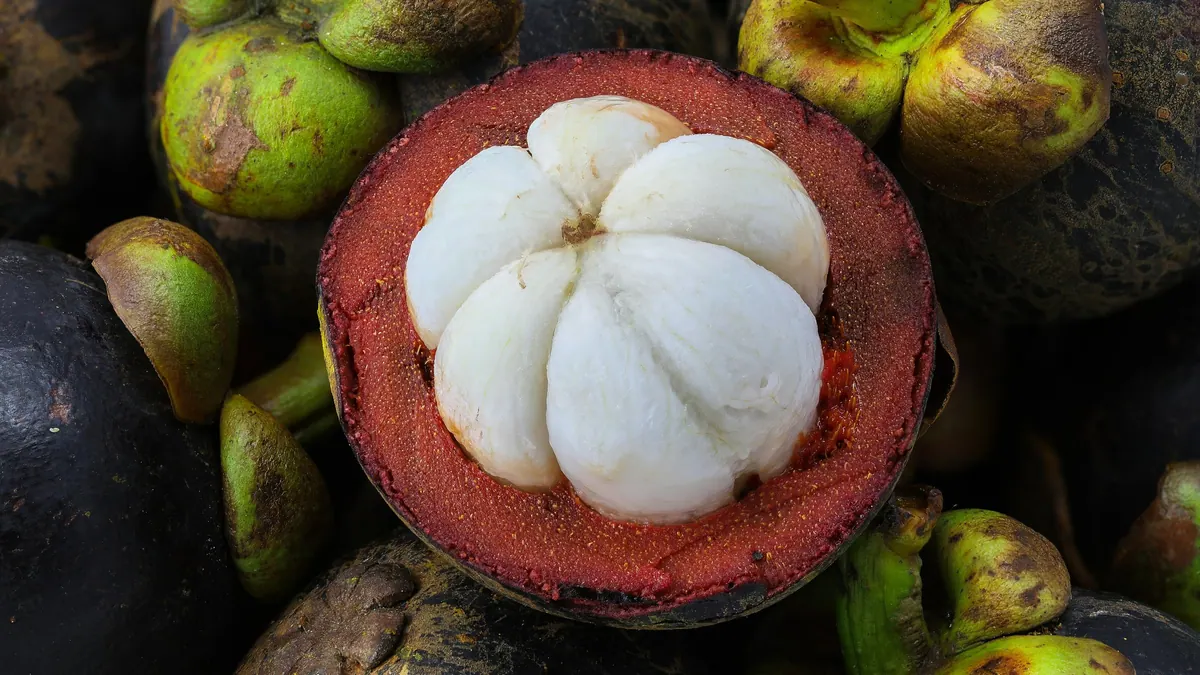
Mangosteen seeds — BMP: 2 studies, weighted mean 544 m³ CH₄/t VS
544 m³ CH₄/t VS weighted mean from 2 studies
≈52 %