

BMP testingFruit, vegetables and their residues
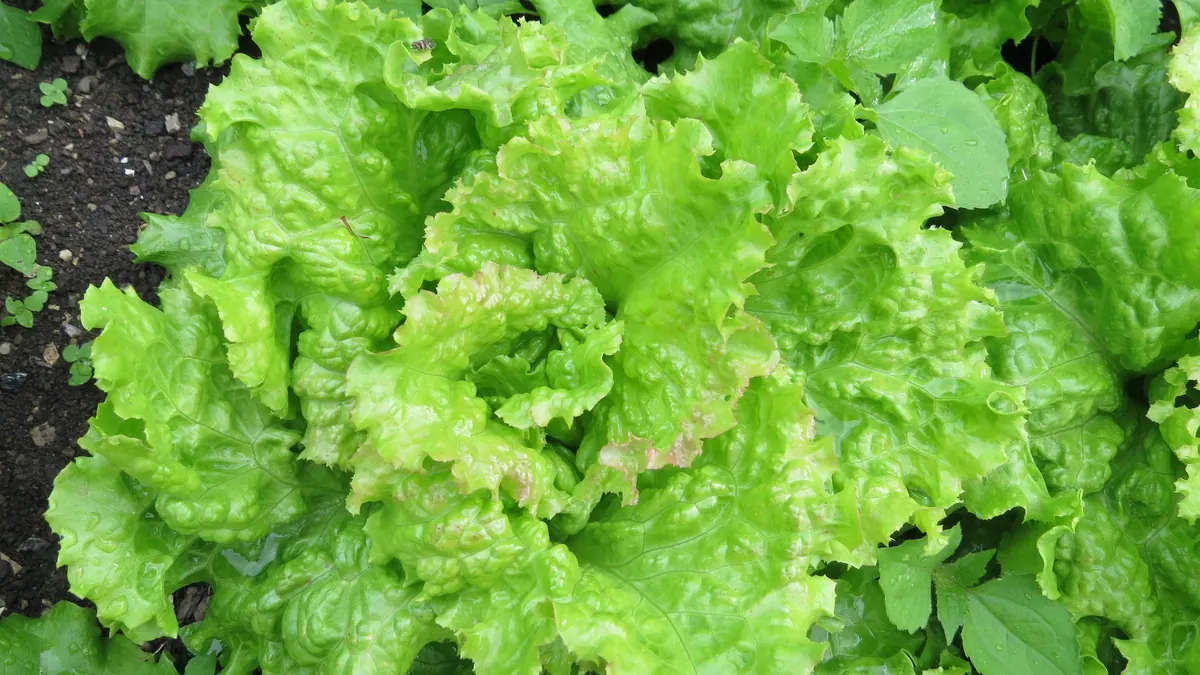
Lettuce — BMP: 6 studies, weighted mean 256 m³ CH₄/t VS
Lettuce is a delicate, almost entirely watery vegetable waste with low lignin, which ferments readily but contributes little dry matter and spoils quickly.
Photo GT1976 / Wikimedia Commons, licence CC BY-SA 4.0, source file; changes: cropping

- Weighted mean
- 256m³ CH₄/t VS
- Range
- 199–294m³ CH₄/t VS
- Records
- 6studies
- Publications
- 5sources
- Temperatures
- 35 °C, 55 °Cof the test
Methane in biogas
Medium methane content · ≈ 5.7 kWh/m³ of biogas
estimate from the substrate type The collected studies contain no measurement. The interval follows from the approximate composition (protein from total nitrogen (N 4.5 % DM × 6.25)) and the yields of compound groups according to FNR.
Rating for biogas plants
not rated — editorial rating for biogas plants
Not rated: no dry matter or volatile solids in the data. We calculate the rating when the dry matter and volatile solids of the material are known.
Add to the co-digestion calculator CSV data
BMP curves from 6 studies
Weighted mean Individual records
Dashed lines are a model curve (first-order kinetics, B(t) = B₀·(1 − e−kt)); the end point comes from the publication. All curves are model curves.
Cumulative methane production over the test [m³ CH₄/t VS]. The thick line is the weighted mean of all records (256); dots mark the end values given in the publications. Point at the chart to read values; click a legend item to hide or show a record.
Records and sources
Download CSV| Source | BMP m³ CH₄/t VS | Temperature | Sample | Curve |
|---|---|---|---|---|
| Yan et al. (2017) · 1 DOI | 199 | — | Lettuce (Lactuca sativa) – Leaf | end point (model curve) |
| Yan et al. (2017) · 2 DOI | 244 | — | Romaine lettuce (Lactuca sativa var. Ramosa) | end point (model curve) |
| Cai et al. (2019) DOI | 231 | — | Lettuce (Lactuca sativa) – Whole | end point (model curve) |
| Buffiere et al. (2006) DOI | 294 | 55 °C · thermophilic | Salad | end point (model curve) |
| Aybek et al. (2017) DOI | 286 | — | Lettuce | end point (model curve) |
| Kouas et al. (2017) DOI | 246 | 35 °C · mesophilic | lettuce | end point (model curve) |
| Weighted mean | 256 | arithmetic mean 250, SD 35 | ||
Typical composition
- Volatile solids (VS)
- 87.3 % DM (range 77.3–88.2)
- Nitrogen
- 4.5 % DM
- C/N ratio
- 8.7
Median and range of the determinations reported in the publications behind this substrate's BMP records (read from: BCBPD); dry matter: 0 determinations, volatile solids: 3 determinations. C/N was calculated as the ratio of C and N content (% DM) from the same source. No DM in the sources – the calculator has to ask for a value.
Sources: Yan et al. (2017); Cai et al. (2019).
The composition of the raw material varies between batches — for plant calculations use an analysis of your own sample. The calculator inserts typical values automatically.
Process properties
Low confidence: the description is based on general characteristics of the substrate group, not on studies of this material. Treat it as a hint to be verified.
No published process studies
The literature we use does not describe the advantages or drawbacks of digesting this substrate beyond the BMP test results. Below are process characteristics assigned on the basis of the type of material — an editorial classification, not a study result.
- dilutes the feed (low DM)
- low dry matter, dilutes the feed
- seasonal
- seasonal availability — requires storage
- poor in trace elements
- poor in trace elements — mono-digestion requires supplementation
- variable composition
- high variability of composition between batches
Co-digestion — what to combine it with, what to watch out for
- combines well
substrates: nitrogen-rich — e.g. Pig slurry, Poultry manure, Waste activated sludge (secondary sludge), Chlorella vulgaris, Nannochloropsis salina
A nitrogen-rich co-substrate balances the low C/N of fruit and vegetable waste (Bouallagui et al. 2009).[1]
Dosing
No source limits on the dose for this substrate.
Sources of the process data
- Improvement of fruit and vegetable waste anaerobic digestion performance and stability with co-substrates addition
- Study on biomethane production and biodegradability of different leafy vegetables in anaerobic digestion
- Prediction of methane production performances based on determination of organic components for different vegetable wastes
- Towards new indicators for the prediction of solid waste anaerobic digestion properties
- Determination and evaluation of biogas and methane productions of vegetable and fruit wastes with Hohenheim Batch Test method
- Robust assessment of both biochemical methane potential and degradation kinetics of solid residues in successive batches
- Effects of size and thermophilic pre-hydrolysis of banana peel during anaerobic digestion, and biomethanation potential of key tropical fruit wastes
- Effect of particle size on biogas generation from biomass residues
The co-digestion calculator will assess a specific mixture containing this substrate.
What it is and where it comes from
Lettuce (Lactuca sativa) is grown in Poland in the open field and under cover, and large quantities of waste arise in fresh lettuce packing houses, in plants producing ready-to-eat mixes (so-called fresh-cut products) and in retail. The waste consists of outer leaves, overgrown specimens and out-of-date batches. The stream is seasonal, but in greenhouse production it is sometimes available for most of the year.
Properties relevant to digestion
Lettuce is almost pure water; the dry matter contains soluble sugars, pectins, hemicellulose, protein and small amounts of lignin. As a result, hydrolysis is rapid and there are no serious structural barriers. The leaves accumulate nitrates, the level of which depends on fertilisation and light conditions, but at average shares in the feed this is not a problem. The risks are acidification when dosed too quickly and a very low organic load per tonne, which makes transport uneconomic. Sand from soil on field-grown leaves can settle in the digester.
How to read the spread of results
The dataset contains several records from several sources, including one under thermophilic conditions and some without a stated temperature. They describe leaf lettuce, romaine lettuce and general samples. The result depends on cultivar, degree of maturity, the share of outer leaves and hearts, freshness (wilted or spoiled leaves change the composition), and also on chopping and inoculum. With such a watery material, the error in determining dry matter strongly affects the result expressed per volatile solids.
In biogas plant practice
Lettuce is used as a supplement to the feed, preferably in a mixture with slurry or a material of higher dry matter content. Chopping is not difficult, but the material spoils quickly and gives off odours, so it should reach the digester within a day or two. Profitability depends on proximity to the source. Waste from packing houses and processing is waste that can be accepted only on the basis of the plant's relevant permits.
A practical solution at lettuce packing plants is to collect the waste in closed containers and pass it to the digester daily, which limits energy losses, odour emissions and the growth of undesirable microorganisms in the material.
Methodology in brief
BMP is the amount of methane obtained from volatile solids (VS) in a batch test, given in m³ CH₄ per tonne of VS (numerically the same as NmL CH₄/g VS in the publications) and converted to normal conditions (0 °C, 101.325 kPa). The weighted mean gives each publication a total weight of 1, split equally between its results for the substrate — a paper testing twenty varieties does not outweigh a paper with a single sample. In inter-laboratory programmes the unit is the laboratory (total weight 1), and within it the weight of a test grows with the number of bottles (replicates). Results after pretreatment (e.g. thermal, chemical, enzymatic) are shown separately and are not included in the mean.
Solid lines are curves measured in the tests. Where a publication gives only the final result, we draw a first-order kinetic model, B(t) = B₀·(1 − e−kt): only the end point comes from the publication, and the shape of the curve serves purely as visualisation — do not read the production on a particular day from it. For this substrate k = 0.245 d−1 was assumed (median of rate constants k reported in the sources and/or fitted to the mean measured curves).
The statistics describe the spread of published results — a descriptive compilation, not a meta-analysis or a guarantee of plant yield.
Bibliography
- Yan, H.; Zhao, C.; Zhang, J.; Zhang, R.; Xue, C.; Liu, G.; Chen, C. (2017). Study on biomethane production and biodegradability of different leafy vegetables in anaerobic digestion. AMB Express 7(1), 27. DOI: 10.1186/s13568-017-0325-1 DOI
- Cai, F.; 1. Biomass Energy and Environmental Engineering Research Center, College of Chemical Engineering, Beijing University of Chemical Technology, Beijing 100029, China; Yan, H.; Zhang, R.; Liu, G.; Chen, C.; 2. Department of Biological and Agricultural Engineering, University of California, Davis, CA 95616, USA (2019). Prediction of methane production performances based on determination of organic components for different vegetable wastes. International Journal of Agricultural and Biological Engineering 12(3), 154–159. DOI: 10.25165/j.ijabe.20191203.4705 DOI
- Buffiere, P.; Loisel, D.; Bernet, N.; Delgenes, J.P. (2006). Towards new indicators for the prediction of solid waste anaerobic digestion properties. Water Science and Technology 53(8), 233–241. DOI: 10.2166/wst.2006.254 DOI
- Aybek, A.; Faculty of Agriculture, Department of Biosystems Engineering, KahramanmarasSutcu Imam University, Kahramanmaras, Turkey; 茜ok, S. (2017). Determination and evaluation of biogas and methane productions of vegetable and fruit wastes with Hohenheim Batch Test method. International Journal of Agricultural and Biological Engineering 10(4), 207–215. DOI: 10.25165/j.ijabe.20171004.2864 DOI
- Kouas, M.; Torrijos, M.; Sousbie, P.; Steyer, J.P.; Sayadi, S.; Harmand, J. (2017). Robust assessment of both biochemical methane potential and degradation kinetics of solid residues in successive batches. Waste Management 70, 59–70. DOI: 10.1016/j.wasman.2017.09.001 DOI
All sources of the site: bibliography.
Other substrates in the group “Fruit, vegetables and their residues”

Pomegranate fruit and processing wastes — BMP: 4 studies, weighted mean 376 m³ CH₄/t VS
376 m³ CH₄/t VS weighted mean from 4 studies
≈52 %
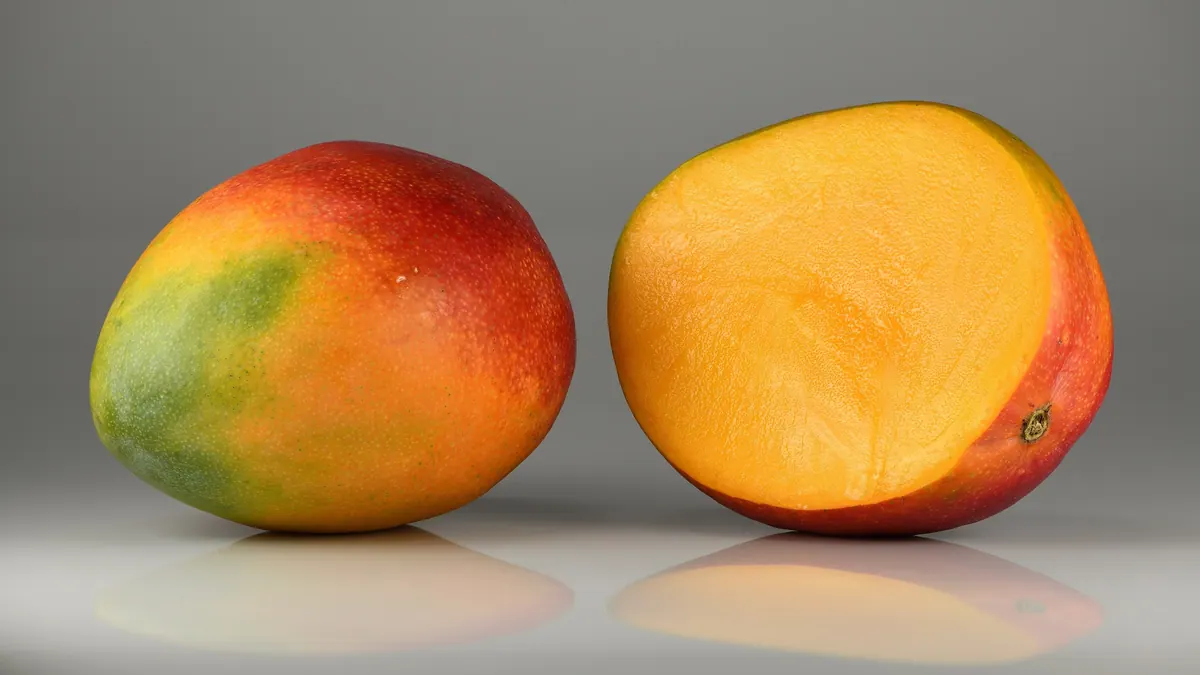
Mango peels — BMP: 13 studies, weighted mean 448 m³ CH₄/t VS
448 m³ CH₄/t VS weighted mean from 13 studies
≈52 %
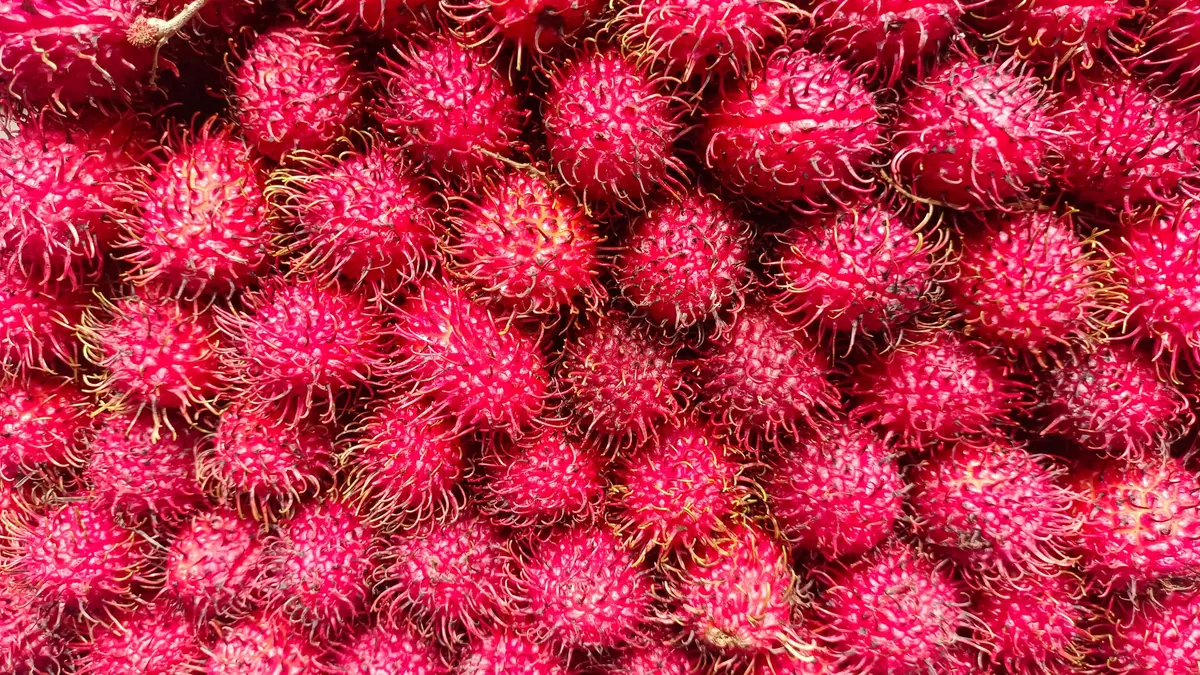
Rambutan peel — BMP: 3 studies, weighted mean 99 m³ CH₄/t VS
99 m³ CH₄/t VS weighted mean from 3 studies
neutral — editorial rating for biogas plants≈52 %
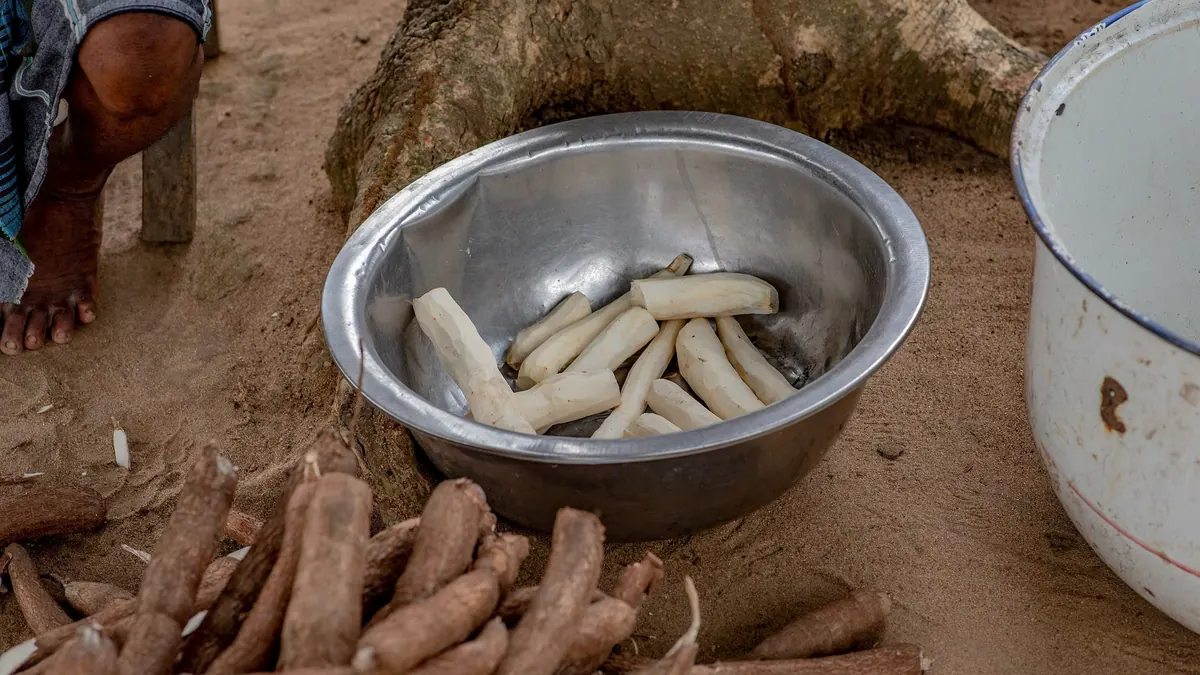
Cassava peels — BMP: 4 studies, weighted mean 268 m³ CH₄/t VS
268 m³ CH₄/t VS weighted mean from 4 studies
≈52 %