

BMP testingFruit, vegetables and their residues
Peaches — BMP: 2 studies, weighted mean 344 m³ CH₄/t VS
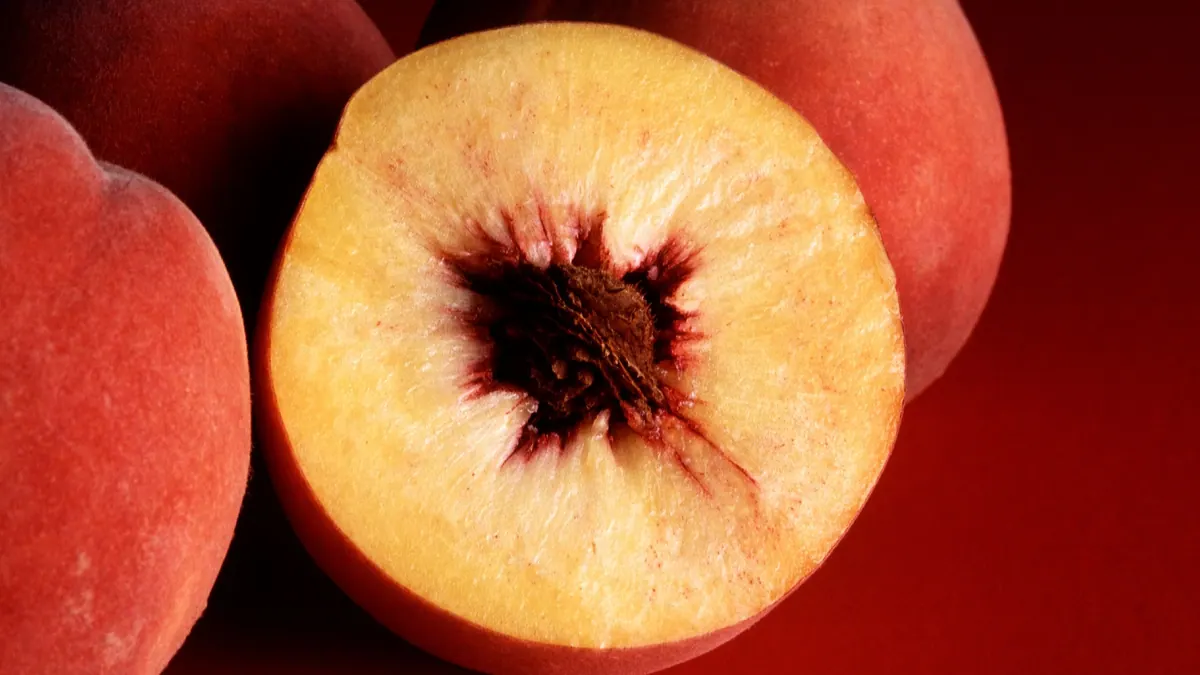
Peaches (waste from markets and processing) contain a lot of sugars and water, so they digest well; the risks are hard stones and rapid acidification.
Photo Jack Dykinga, USDA / Wikimedia Commons, public domain, source file; changes: cropping

- Weighted mean
- 344m³ CH₄/t VS
- Range
- 334–353m³ CH₄/t VS
- Records
- 2studies
- Publications
- 2sources
- Temperatures
- 35 °Cof the test
Methane in biogas
Medium methane content · ≈ 5.2 kWh/m³ of biogas
estimate from the substrate type The collected studies contain no measurement. The interval follows from the approximate composition (carbohydrate-dominated (no protein or fat characteristics)) and the yields of compound groups according to FNR.
Rating for biogas plants
not rated — editorial rating for biogas plants
Not rated: no dry matter or volatile solids in the data. We calculate the rating when the dry matter and volatile solids of the material are known.
Add to the co-digestion calculator CSV data
BMP curves from 2 studies
Weighted mean Individual records
Dashed lines are a model curve (first-order kinetics, B(t) = B₀·(1 − e−kt)); the end point comes from the publication. All curves are model curves.
Cumulative methane production over the test [m³ CH₄/t VS]. The thick line is the weighted mean of all records (344); dots mark the end values given in the publications. Point at the chart to read values; click a legend item to hide or show a record.
Records and sources
Download CSV| Source | BMP m³ CH₄/t VS | Temperature | Sample | Curve |
|---|---|---|---|---|
| Aybek et al. (2017) DOI | 353 | — | Peach | end point (model curve) |
| Kouas et al. (2017) DOI | 334 | 35 °C · mesophilic | peach | end point (model curve) |
| Weighted mean | 344 | arithmetic mean 344, SD 13 | ||
Process properties
Low confidence: the description is based on general characteristics of the substrate group, not on studies of this material. Treat it as a hint to be verified.
No published process studies
The literature we use does not describe the advantages or drawbacks of digesting this substrate beyond the BMP test results. Below are process characteristics assigned on the basis of the type of material — an editorial classification, not a study result.
- easily degradable
- sugars, starch, glycerol → fast hydrolysis and acidification (VFA), needs buffering
- acidic
- low pH of the substrate (silages, stillage, whey, fruit)
- dilutes the feed (low DM)
- low dry matter, dilutes the feed
- seasonal
- seasonal availability — requires storage
- poor in trace elements
- poor in trace elements — mono-digestion requires supplementation
- carbon-rich
- high C/N → nitrogen deficiency; combine well with nitrogen-rich substrates
- low in nitrogen
- high C/N → nitrogen deficiency; combine well with nitrogen-rich substrates
Co-digestion — what to combine it with, what to watch out for
- combines well
substrates: nitrogen-rich — e.g. Pig slurry, Poultry manure, Waste activated sludge (secondary sludge), Chlorella vulgaris, Nannochloropsis salina
A nitrogen-rich co-substrate balances the low C/N of fruit and vegetable waste (Bouallagui et al. 2009).[1]
- combines well
substrates: high alkalinity (buffer) — e.g. Cattle manure, Pig slurry, Cattle slurry, Duck slurry, Rumen and digestive tract content
Co-digestion of easily degradable substrates with dairy slurry increased the methane yield relative to slurry alone.[2]
Dosing
No source limits on the dose for this substrate.
Introduce gradually, starting with a small dose and monitoring the process (e.g. FOS/TAC, pH, gas composition).
Sources of the process data
- Improvement of fruit and vegetable waste anaerobic digestion performance and stability with co-substrates addition
- Biochemical methane potential and biodegradability of complex organic substrates
- Determination and evaluation of biogas and methane productions of vegetable and fruit wastes with Hohenheim Batch Test method
- Robust assessment of both biochemical methane potential and degradation kinetics of solid residues in successive batches
- Effects of size and thermophilic pre-hydrolysis of banana peel during anaerobic digestion, and biomethanation potential of key tropical fruit wastes
- Effect of particle size on biogas generation from biomass residues
The co-digestion calculator will assess a specific mixture containing this substrate.
What it is and where it comes from
Peaches are fruit grown in orchards in warmer regions, also in Poland on a small scale. Waste arises during sorting, in processing (pulps, canned goods) and in retail, where damaged and overripe fruit is rejected. The dataset contains several records: peach waste from a market, ground to particle sizes of 1 and 3 mm, and a sample with no detailed description, tested at mesophilic temperature.
Properties relevant to digestion
The flesh consists of water (over 85%), simple sugars and pectins, which are rapidly degraded. The ready availability of sugars promotes abrupt acidification at a high dose. The stones have hard shells rich in lignin, which degrade very poorly, and the seeds contain amygdalin, which releases hydrogen cyanide, although in amounts that are not a barrier in typical waste streams. The skins contain pectins and polyphenols. A low protein content means a low risk of ammonia.
How to read the spread of results
The records are similar, but come from different studies, and the result depends on the share of stones, the ripeness of the fruit, the variety and the degree of size reduction (one study compared grinding to two sizes). Temperature, inoculum, the substrate-to-inoculum ratio and test length are significant, as is the method of conversion to VS. A small number of records does not indicate a typical range for peaches.
In biogas plant practice
Peaches can be used as a co-substrate in installations accepting waste from fruit sorting and processing, best in a mixture with buffering materials. Stones should be removed or well size-reduced so that they do not damage pumps. Dosing should be even and prompt after delivery. Fruit waste is usually classified as waste (group 02 or 20), and its acceptance requires installation permits; plant raw material is not subject to the regulations on animal by-products.
For comparison with apples, peaches have soft flesh, so they are easier to size-reduce, but the stone makes up a larger part of the mass. The flesh alone degrades very well, and its share in the waste is the main factor determining the result. The method of separating the stones should therefore be agreed with the supplier.
Methodology in brief
BMP is the amount of methane obtained from volatile solids (VS) in a batch test, given in m³ CH₄ per tonne of VS (numerically the same as NmL CH₄/g VS in the publications) and converted to normal conditions (0 °C, 101.325 kPa). The weighted mean gives each publication a total weight of 1, split equally between its results for the substrate — a paper testing twenty varieties does not outweigh a paper with a single sample. In inter-laboratory programmes the unit is the laboratory (total weight 1), and within it the weight of a test grows with the number of bottles (replicates). Results after pretreatment (e.g. thermal, chemical, enzymatic) are shown separately and are not included in the mean.
Solid lines are curves measured in the tests. Where a publication gives only the final result, we draw a first-order kinetic model, B(t) = B₀·(1 − e−kt): only the end point comes from the publication, and the shape of the curve serves purely as visualisation — do not read the production on a particular day from it. For this substrate k = 0.245 d−1 was assumed (median of rate constants k reported in the sources and/or fitted to the mean measured curves).
The statistics describe the spread of published results — a descriptive compilation, not a meta-analysis or a guarantee of plant yield.
Bibliography
- Aybek, A.; Faculty of Agriculture, Department of Biosystems Engineering, KahramanmarasSutcu Imam University, Kahramanmaras, Turkey; 茜ok, S. (2017). Determination and evaluation of biogas and methane productions of vegetable and fruit wastes with Hohenheim Batch Test method. International Journal of Agricultural and Biological Engineering 10(4), 207–215. DOI: 10.25165/j.ijabe.20171004.2864 DOI
- Kouas, M.; Torrijos, M.; Sousbie, P.; Steyer, J.P.; Sayadi, S.; Harmand, J. (2017). Robust assessment of both biochemical methane potential and degradation kinetics of solid residues in successive batches. Waste Management 70, 59–70. DOI: 10.1016/j.wasman.2017.09.001 DOI
All sources of the site: bibliography.
Other substrates in the group “Fruit, vegetables and their residues”
Pineapple peels — BMP: 2 studies, weighted mean 194 m³ CH₄/t VS
194 m³ CH₄/t VS weighted mean from 2 studies
≈52 %
Onions — BMP: 2 studies, weighted mean 305 m³ CH₄/t VS
305 m³ CH₄/t VS weighted mean from 2 studies
≈52 %
Banana peels — BMP: 17 studies, weighted mean 330 m³ CH₄/t VS
330 m³ CH₄/t VS weighted mean from 17 studies
good — editorial rating for biogas plants≈52 %
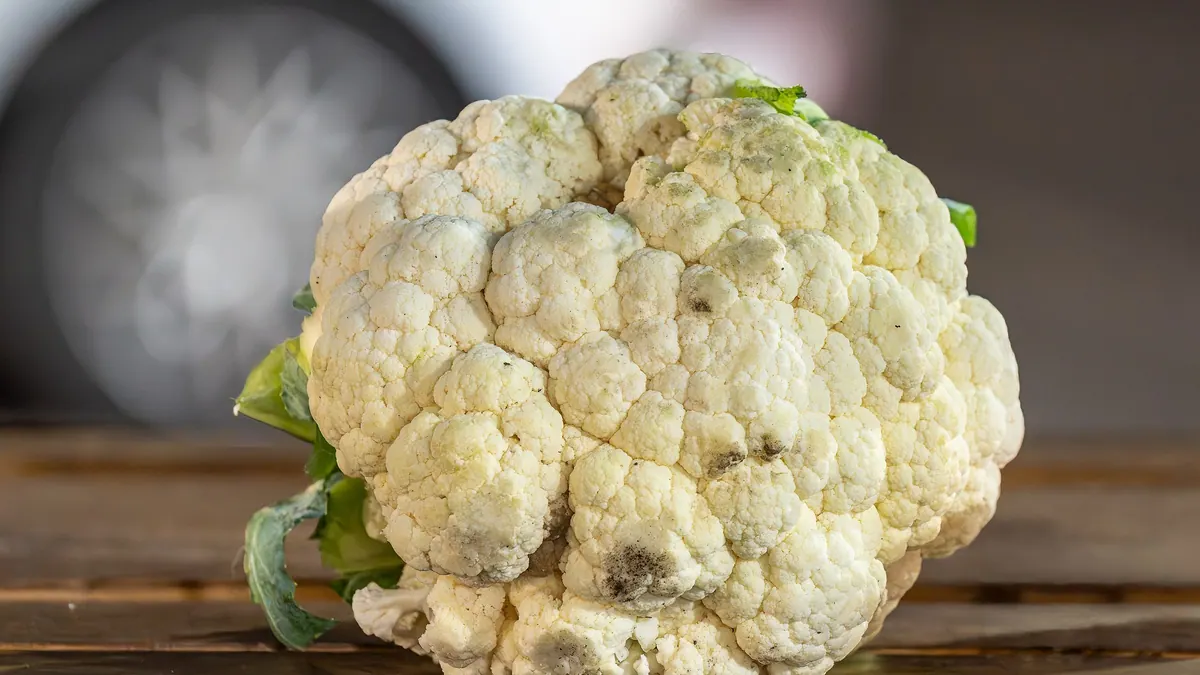
Cauliflower — BMP: 2 studies, weighted mean 274 m³ CH₄/t VS
274 m³ CH₄/t VS weighted mean from 2 studies
≈59 %