

BMP testingMunicipal and green waste, paper and textiles
Tree leaves (leaf litter) — BMP: 7 studies, weighted mean 202 m³ CH₄/t VS
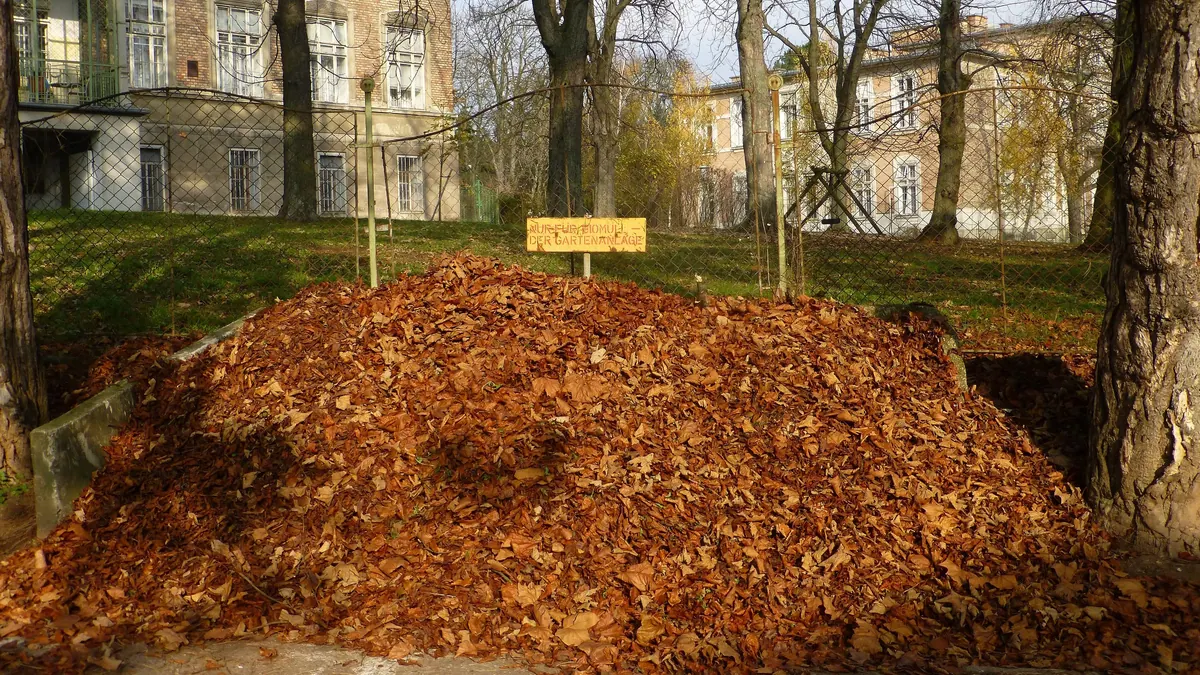
Tree leaves (autumn leaf fall, e.g. birch and maple) contain a lot of lignin and tannins, so they digest poorly and slowly; they are a seasonal waste from urban green space.
Photo Wald1siedel / Wikimedia Commons, licence CC BY-SA 3.0, source file; changes: cropping

- Weighted mean
- 202m³ CH₄/t VS
- Range
- 123–338m³ CH₄/t VS
- Records
- 7studies
- Publications
- 4sources
- Temperatures
- 35 °C, 38 °Cof the test
Methane in biogas
Medium methane content · ≈ 5.2 kWh/m³ of biogas
estimate from the substrate type The collected studies contain no measurement. The interval follows from the approximate composition (carbohydrate-dominated (no protein or fat characteristics)) and the yields of compound groups according to FNR.
Rating for biogas plants
not rated — editorial rating for biogas plants
Not rated: no dry matter or volatile solids in the data. We calculate the rating when the dry matter and volatile solids of the material are known.
Add to the co-digestion calculator CSV data
BMP curves from 7 studies
Weighted mean Individual records
Dashed lines are a model curve (first-order kinetics, B(t) = B₀·(1 − e−kt)); the end point comes from the publication. All curves are model curves.
Cumulative methane production over the test [m³ CH₄/t VS]. The thick line is the weighted mean of all records (202); dots mark the end values given in the publications. Point at the chart to read values; click a legend item to hide or show a record.
Records and sources
Download CSV| Source | BMP m³ CH₄/t VS | Temperature | Sample | Curve |
|---|---|---|---|---|
| Dubrovskis i Plume (2021) · 1 DOI | 262 | 38 °C · mesophilic | Apple leaves | end point (model curve) |
| Dubrovskis i Plume (2021) · 2 DOI | 280 | 38 °C · mesophilic | Maple leaves | end point (model curve) |
| Dubrovskis i Plume (2021) · 3 DOI | 338 | 38 °C · mesophilic | Cherry and pear leaves mixture | end point (model curve) |
| Klavins et al. (2020) DOI | 151 | 38 °C · mesophilic | Oak leaves (shredded, milled) | end point (model curve) |
| Nallathambi Gunaseelan (1997) DOI | 123 | 35 °C · mesophilic | leaves (from municipal waste) (orig.: “Leaves”): value quoted in a literature review | end point (model curve) |
| Dubrovskis i Dubrovskis (2024) · 1 DOI | 219 | 38 °C · mesophilic | Birch leaves | end point (model curve) |
| Dubrovskis i Dubrovskis (2024) · 2 DOI | 262 | 38 °C · mesophilic | Maple leaves | end point (model curve) |
| Weighted mean | 202 | arithmetic mean 234, SD 75 | ||
Typical composition
- Volatile solids (VS)
- 95 % DM (range 95–95)
Median and range of the determinations reported in the publications behind this substrate's BMP records (read from: MY-D); dry matter: 0 determinations, volatile solids: 1 determination. No DM in the sources – the calculator has to ask for a value.
Sources: Nallathambi Gunaseelan (1997).
The composition of the raw material varies between batches — for plant calculations use an analysis of your own sample. The calculator inserts typical values automatically.
Process properties
Low confidence: the description is based on general characteristics of the substrate group, not on studies of this material. Treat it as a hint to be verified.
Advantages
- Methane potential in the Substraty.pl BMP set: weighted mean 202.0 m³ CH₄/t VS (SD 75.2; 7 records, 4 sources).
Drawbacks and risks
- Lignin and tannins limit degradation (Chen et al. 2008; Hendriks and Zeeman 2009).
- Sand and litter.
Co-digestion — what to combine it with, what to watch out for
- combines well
substrates: high alkalinity (buffer) — e.g. Cattle manure, Pig slurry, Cattle slurry, Duck slurry, Rumen and digestive tract content
Dosing
No source threshold.
Introduce gradually, starting with a small dose and monitoring the process (e.g. FOS/TAC, pH, gas composition).
Practical requirements
- Shred: shredding increases the surface available for degradation and speeds it up, but does not necessarily raise the final gas yield (FNR 2010, Ch. 3 “Triturado”).
Sources of the process data
- Hagos et al. (2017). Anaerobic co-digestion process for biogas production: progress, challenges and perspectives. Renew. Sustain. Energy Rev.
- Weiland, P. (2010) Biogas production: current state and perspectives. Applied Microbiology and Biotechnology
- Hendriks, Zeeman (2009). Pretreatments to enhance the digestibility of lignocellulosic biomass. Bioresour. Technol.
- Chen, Cheng, Creamer (2008). Inhibition of anaerobic digestion process: A review. Bioresour. Technol.
- FNR (2010). Guía sobre el Biogás – Desde la producción hasta el uso (hiszp. wydanie „Leitfaden Biogas”, GIZ 2013)
The co-digestion calculator will assess a specific mixture containing this substrate.
What it is and where it comes from
Tree leaves are fallen leaves from parks, streets and gardens, raked and collected in autumn. In cities they make up a considerable part of green waste, going to composting plants or biogas plants. The dataset includes birch leaves, maple leaves and leaves from municipal waste (a value cited in a review). The material is highly seasonal: most of the annual quantity arises within a few weeks in autumn.
Properties relevant to digestion
Leaves have a relatively high lignin content, as well as tannins and other polyphenols, which can inhibit microorganisms. The nitrogen content is low, so the C/N ratio is high, and nitrogen deficiency limits digestion in mono-digestion. The dry matter content is high, and the material is light and airy, which makes dosing difficult and promotes floating in the digester. Fallen leaves contain sand, stones and litter, which must be removed. Leaves lying for a longer time undergo partial decomposition, which changes their composition.
How to read the spread of results
The spread results from the tree species (birch, maple, oak or horse chestnut leaves differ in composition, including the amount of tannins), the degree of maturity and decomposition at the time of collection, and the method of storage. Comminution, test duration (slow decomposition requires long incubation), temperature and inoculum also matter. One of the values was cited in a review, with a less detailed description. With a small number of records, the spread does not describe the full variability of the material.
In biogas plant practice
Leaves are a difficult substrate: low unit energy, seasonality and the risk of forming a floating crust mean that in biogas plants they are usually only an admixture to biowaste. They can serve as a structural material. They require shredding and mixing with nitrogen-rich substrates, and foreign contaminants (sand, stones) should be removed. Leaves from green space maintenance are waste (codes of group 20), and their acceptance requires the installation's permit; they are often sent for composting.
For comparison with grass and kitchen waste, leaves contribute little energy per tonne, and their main advantage is that they are available at no feedstock cost. This matters for municipalities that have to manage them and look for solutions cheaper than transport over long distances. Before making a decision, it is worth running a test on local leaves.
Methodology in brief
BMP is the amount of methane obtained from volatile solids (VS) in a batch test, given in m³ CH₄ per tonne of VS (numerically the same as NmL CH₄/g VS in the publications) and converted to normal conditions (0 °C, 101.325 kPa). The weighted mean gives each publication a total weight of 1, split equally between its results for the substrate — a paper testing twenty varieties does not outweigh a paper with a single sample. In inter-laboratory programmes the unit is the laboratory (total weight 1), and within it the weight of a test grows with the number of bottles (replicates). Results after pretreatment (e.g. thermal, chemical, enzymatic) are shown separately and are not included in the mean.
Solid lines are curves measured in the tests. Where a publication gives only the final result, we draw a first-order kinetic model, B(t) = B₀·(1 − e−kt): only the end point comes from the publication, and the shape of the curve serves purely as visualisation — do not read the production on a particular day from it. For this substrate k = 0.110 d−1 was assumed (median of rate constants k reported in the sources and/or fitted to the mean measured curves).
The statistics describe the spread of published results — a descriptive compilation, not a meta-analysis or a guarantee of plant yield.
Bibliography
- Dubrovskis, V.; Plume, I. (2021). Methane potential from household garden leaves. Engineering for Rural Development 20. DOI: 10.22616/erdev.2021.20.tf307 DOI
- Klavins, A.; Dubrovskis, V.; Plume, I. (2020). Effectiveness of usage of straw and oak leave pellets for biogas production. Engineering for Rural Development 19. DOI: 10.22616/erdev.2020.19.tf529 DOI
- Nallathambi Gunaseelan, V. (1997). Anaerobic digestion of biomass for methane production: A review. Biomass and Bioenergy 13(1-2), 83–114. DOI: 10.1016/s0961-9534(97)00020-2 DOI
- Dubrovskis, V.; Dubrovskis, D. (2024). Methane production from birch and maple leaves and miscanthus grass. Engineering for Rural Development 23. DOI: 10.22616/erdev.2024.23.tf106 DOI
All sources of the site: bibliography.
Other substrates in the group “Municipal and green waste, paper and textiles”

Magazine paper — BMP: 6 studies, weighted mean 243 m³ CH₄/t VS
243 m³ CH₄/t VS weighted mean from 6 studies
good — editorial rating for biogas plants≈51 %

Cotton textiles (incl. denim) — BMP: 7 studies, weighted mean 239 m³ CH₄/t VS
239 m³ CH₄/t VS weighted mean from 7 studies
neutral — editorial rating for biogas plants≈51 %
Grass clippings — BMP: 13 studies, weighted mean 272 m³ CH₄/t VS
272 m³ CH₄/t VS weighted mean from 13 studies
neutral — editorial rating for biogas plants≈52 %

Office paper — BMP: 9 studies, weighted mean 314 m³ CH₄/t VS
314 m³ CH₄/t VS weighted mean from 9 studies
good — editorial rating for biogas plants≈51 %