

BMP testingFruit, vegetables and their residues
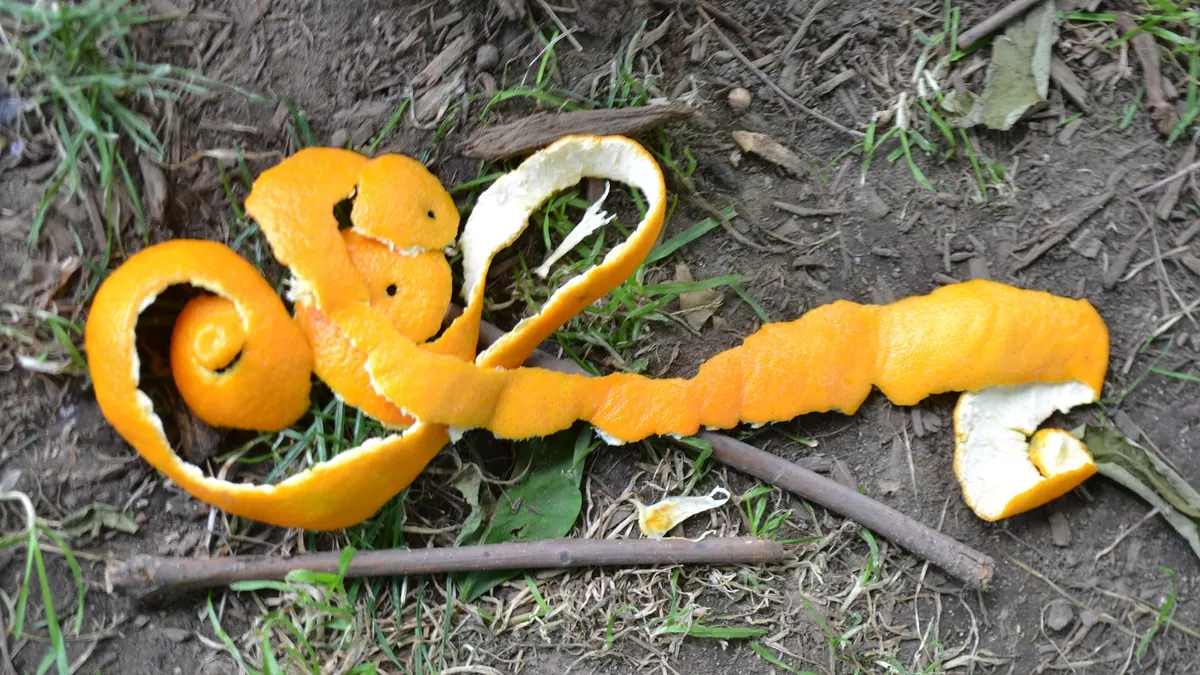
Citrus peels — BMP: 12 studies, weighted mean 313 m³ CH₄/t VS
Citrus fruit peels contain pectins and limonene, which inhibits fermentation; the results differ greatly, especially after ensiling or stripping of the oils.
rating: neutralCH₄ ≈ 52 % (estimate)
Photo SayCheeeeeese / Wikimedia Commons, licence CC0 1.0, source file; changes: cropping

- Weighted mean
- 313m³ CH₄/t VS
- Range
- 48–696m³ CH₄/t VS
- Records
- 12studies
- Publications
- 6sources
- Temperatures
- 35 °C, 38 °Cof the test
Methane in biogas
Low methane content · ≈ 5.2 kWh/m³ of biogas
estimate from the substrate type The collected studies contain no measurement. The interval follows from the approximate composition (protein from total nitrogen (N 0.8 % DM × 6.25)) and the yields of compound groups according to FNR.
Rating for biogas plants
neutral — editorial rating for biogas plantsNo clear advantages — worth charging a fee for accepting it
Potential per tonne of fresh matter: high (64 m³ CH₄/t); process risk: inhibitors, acidification. No additional handling requirements.
Why? Rating factors
Potential per tonne +2
- +2potential 64 m³ CH₄/t fresh matter (BMP 313 × DM 21.1 % × VS 96.8 %)
Process stability −1.5
- −1inhibitors: natural or residues (e.g. limonene, polyphenols, antibiotics, metals)
- −0.5acidification: rapid degradation / acidic pH, risk of VFA accumulation, needs buffering
Handling and costs 0
- 0no factors
Total points: 0.5 · thresholds: ≥ 2.5 very good, ≥ 1 good, below — neutral; negative with cumulative process risk.
Add to the co-digestion calculator CSV data
BMP curves from 12 studies
Weighted mean Individual records
Dashed lines are a model curve (first-order kinetics, B(t) = B₀·(1 − e−kt)); the end point comes from the publication. All curves are model curves.
Cumulative methane production over the test [m³ CH₄/t VS]. The thick line is the weighted mean of all records (313); dots mark the end values given in the publications. Point at the chart to read values; click a legend item to hide or show a record.
Records and sources
Download CSV| Source | BMP m³ CH₄/t VS | Temperature | Sample | Curve |
|---|---|---|---|---|
| Calabrò et al. (2020) · 1 DOI | 415 | 35 °C · mesophilic | orange peel waste - raw | end point (model curve) |
| Calabrò et al. (2020) · 2 DOI | 647 | 35 °C · mesophilic | orange peel waste - dry ensiling | end point (model curve) |
| Calabrò et al. (2020) · 3 DOI | 688 | 35 °C · mesophilic | orange peel waste - naturaly ensilaged | end point (model curve) |
| Calabrò et al. (2020) · 4 DOI | 696 | 35 °C · mesophilic | orange peel waste - wet ensiling | end point (model curve) |
| Dubrovskis i Plume (2022) DOI | 487 | 38 °C · mesophilic | Orange mandarin peel | end point (model curve) |
| Fagbohungbe et al. (2016) DOI | 154 | 35 °C · mesophilic | Citrus peel | end point (model curve) |
| Wikandari et al. (2015) · 1 DOI | 61 | — | Untreated orange peel, chopped | end point (model curve) |
| Wikandari et al. (2015) · 2 DOI | 131 | — | Untreated orange peel, homogenized | end point (model curve) |
| Gunaseelan (2004) · 1 DOI | 455 | 35 °C · mesophilic | citrus sinesis peels | end point (model curve) |
| Gunaseelan (2004) · 2 DOI | 486 | 35 °C · mesophilic | Mandarin peels | end point (model curve) |
| Sanjaya et al. (2016) · 1 DOI | 48 | 35 °C · mesophilic | Rooten orange peel | end point (model curve) |
| Sanjaya et al. (2016) · 2 DOI | 72 | 35 °C · mesophilic | Fresh ripe orange peel | end point (model curve) |
| Weighted mean | 313 | arithmetic mean 362, SD 254 | ||
Typical composition
- Dry matter (DM)
- 21.1% (range 14.2–26.2)
- Volatile solids (VS)
- 96.8 % DM (range 94.7–97.3)
- Nitrogen
- 0.8 % DM
- C/N ratio
- 52.1
Median and range of the determinations reported in the publications behind this substrate's BMP records (read from: MY-D); dry matter: 4 determinations, volatile solids: 4 determinations. C/N was calculated as the ratio of C and N content (% DM) from the same source.
Sources: Calabrò et al. (2020); Fagbohungbe et al. (2016); Gunaseelan (2004); Sanjaya et al. (2016).
The composition of the raw material varies between batches — for plant calculations use an analysis of your own sample. The calculator inserts typical values automatically.
Process properties
Advantages
- Methane yield in the compendium: median 435 (range 48–696) m³ CH₄/t VS, 12 records from 6 papers (weighted mean 313).
- In the compendium the highest results for orange peel related to ensiled peel (ensiling was studied as a way of preparing peel for digestion) (Calabrò et al. (2020))
- Strategies for removing the inhibitory limonene (extraction, fungal pretreatment) are described in the literature (Ruiz and Flotats (2014))
Drawbacks and risks
- Biochar shortened the lag phase of citrus peel, but the presence of the peel itself inhibited the process (Fagbohungbe et al. (2016))
- Citrus essential oils may inhibit digestion; divergent values have been reported for the limonene threshold dose (24–192 mg oil/l reactor·d) (Ruiz and Flotats (2014))
- Limonene is an antimicrobial agent that hinders biogas production from orange peel (Wikandari et al. (2015))
Co-digestion — what to combine it with, what to watch out for
- caution
substrates: contains inhibitors — e.g. Pulp and paper mill biosludge, Spent coffee grounds, Sargassum biomass, Pig slurry, Municipal sewage sludge (mixed)
Citrus limonene is described as an inhibitor; according to the review by Chen et al., inhibitors (ammonia, sulphides, metal ions, organic compounds) are the main cause of digestion failures, so accumulation with other substrates carrying this tag should be monitored.[1][2]
Dosing
Review by Ruiz and Flotats (2014): for a stable process the limonene threshold dose was reported inconsistently, in the range of 24–192 mg citrus oil per litre of reactor per day. This is a dose of oil, not a mass share of the substrate, so max_share remains empty.
Introduce gradually, starting with a small dose and monitoring the process (e.g. FOS/TAC, pH, gas composition).
Practical requirements
- Remove or recover limonene before digestion (extraction, fungal pretreatment); hexane leaching increased production more than threefold, but residual hexane reduced methane production by 28.6% (Ruiz and Flotats (2014); Wikandari et al. (2015))
- Adding biochar shortened the lag phase of citrus peel (7.5–9.4 days depending on the proportion) (Fagbohungbe et al. (2016))
Sources of the process data
- Citrus essential oils and their influence on the anaerobic digestion process: an overview
- Inhibition of anaerobic digestion process: A review
- Optimization of orange peel waste ensiling for sustainable anaerobic digestion
- Anaerobic fermentation of kitchen waste
- Impact of biochar on the anaerobic digestion of citrus peel waste
- Improvement of Biogas Production from Orange Peel Waste by Leaching of Limonene
- Biochemical methane potential of fruits and vegetable solid waste feedstocks
- Mesophilic batch anaerobic digestion from fruit fragments
The co-digestion calculator will assess a specific mixture containing this substrate.
What it is and where it comes from
Citrus peels (oranges, mandarins, lemons, grapefruits) arise in juice production, in fruit processing and in catering and trade. Citrus fruit is not grown in Poland, but it is widely imported, so the waste occurs in juice plants and processing plants. The peels are a rich source of pectins, which are sometimes recovered industrially, and of essential oils.
Properties relevant to digestion
The peel contains pectins, cellulose, hemicellulose and soluble sugars, with moderate lignin. The most important feature is the content of essential oils, above all D-limonene, which has a strong antimicrobial action. In studies, inhibition of methanogenesis was observed when the concentration of limonene in the feed was high, so the share of peels is limited or they are pretreated (stripping of the oils, ensiling, composting). The acidity of the peels lowers the pH of the feed. The material quickly goes mouldy, and pectins break down to methanol and acids, which additionally affects the course of the process.
How to read the spread of results
The spread of results is very large here. The dataset contains several records from several sources, among them orange peels fresh and ensiled dry, wet and naturally. Ensiling changes the content of oils and sugars, so the result depends on the method of preservation. The citrus species, fruit ripeness, the method of obtaining the peels (manual, mechanical, after juice pressing), chopping, inoculum maturity and substrate loading are also important. The results of tests without adaptation of the inoculum to limonene are often strongly underestimated.
In biogas plant practice
Citrus peels are added in a small share, preferably after chopping and in a mixture with slurry or sludge. Pretreatment (ensiling, steam stripping of the oils) reduces the risk of inhibition and is sometimes worthwhile for larger streams. The pH and volatile acids should be monitored. Storage in the fresh state leads to mould and losses. Waste from fruit processing is waste, so its management in a biogas plant requires appropriate permits, and for post-production waste also account must be taken of possible residues of preservatives.
The result of a short test without inoculum adaptation is often worse than in a plant operating continuously on citrus, because the microflora adapts to limonene; on the other hand, a sudden large dose of peels can inhibit biogas production within a few days.
Methodology in brief
BMP is the amount of methane obtained from volatile solids (VS) in a batch test, given in m³ CH₄ per tonne of VS (numerically the same as NmL CH₄/g VS in the publications) and converted to normal conditions (0 °C, 101.325 kPa). The weighted mean gives each publication a total weight of 1, split equally between its results for the substrate — a paper testing twenty varieties does not outweigh a paper with a single sample. In inter-laboratory programmes the unit is the laboratory (total weight 1), and within it the weight of a test grows with the number of bottles (replicates). Results after pretreatment (e.g. thermal, chemical, enzymatic) are shown separately and are not included in the mean.
Solid lines are curves measured in the tests. Where a publication gives only the final result, we draw a first-order kinetic model, B(t) = B₀·(1 − e−kt): only the end point comes from the publication, and the shape of the curve serves purely as visualisation — do not read the production on a particular day from it. For this substrate k = 0.245 d−1 was assumed (median of rate constants k reported in the sources and/or fitted to the mean measured curves).
The statistics describe the spread of published results — a descriptive compilation, not a meta-analysis or a guarantee of plant yield.
Bibliography
- Calabrò, P.S.; Fazzino, F.; Sidari, R.; Zema, D.A. (2020). Optimization of orange peel waste ensiling for sustainable anaerobic digestion. Renewable Energy 154, 849–862. DOI: 10.1016/j.renene.2020.03.047 DOI
- Dubrovskis, V.; Plume, I. (2022). Anaerobic fermentation of kitchen waste. Engineering for Rural Development 21. DOI: 10.22616/erdev.2022.21.tf020 DOI
- Fagbohungbe, M.O.; Herbert, B.M.; Hurst, L.; Li, H.; Usmani, S.Q.; Semple, K.T. (2016). Impact of biochar on the anaerobic digestion of citrus peel waste. Bioresource Technology 216, 142–149. DOI: 10.1016/j.biortech.2016.04.106 DOI
- Wikandari, R.; Nguyen, H.; Millati, R.; Niklasson, C.; Taherzadeh, M.J. (2015). Improvement of Biogas Production from Orange Peel Waste by Leaching of Limonene. BioMed Research International 2015, 1–6. DOI: 10.1155/2015/494182 DOI
- Gunaseelan, V. (2004). Biochemical methane potential of fruits and vegetable solid waste feedstocks. Biomass and Bioenergy 26(4), 389–399. DOI: 10.1016/j.biombioe.2003.08.006 DOI
- Sanjaya, A.P.; Cahyanto, M.N.; Millati, R. (2016). Mesophilic batch anaerobic digestion from fruit fragments. Renewable Energy 98, 135–141. DOI: 10.1016/j.renene.2016.02.059 DOI
All sources of the site: bibliography.
Other substrates in the group “Fruit, vegetables and their residues”
Tomatoes — BMP: 7 studies, weighted mean 291 m³ CH₄/t VS
291 m³ CH₄/t VS weighted mean from 7 studies
≈55 %
Whole legume vegetables (green soybean, mung bean, adzuki bean, lablab) — BMP: 4 studies, mean 261 m³ CH₄/t VS
261 m³ CH₄/t VS weighted mean from 4 studies
≈55 %
Peaches — BMP: 2 studies, weighted mean 344 m³ CH₄/t VS
344 m³ CH₄/t VS weighted mean from 2 studies
≈52 %
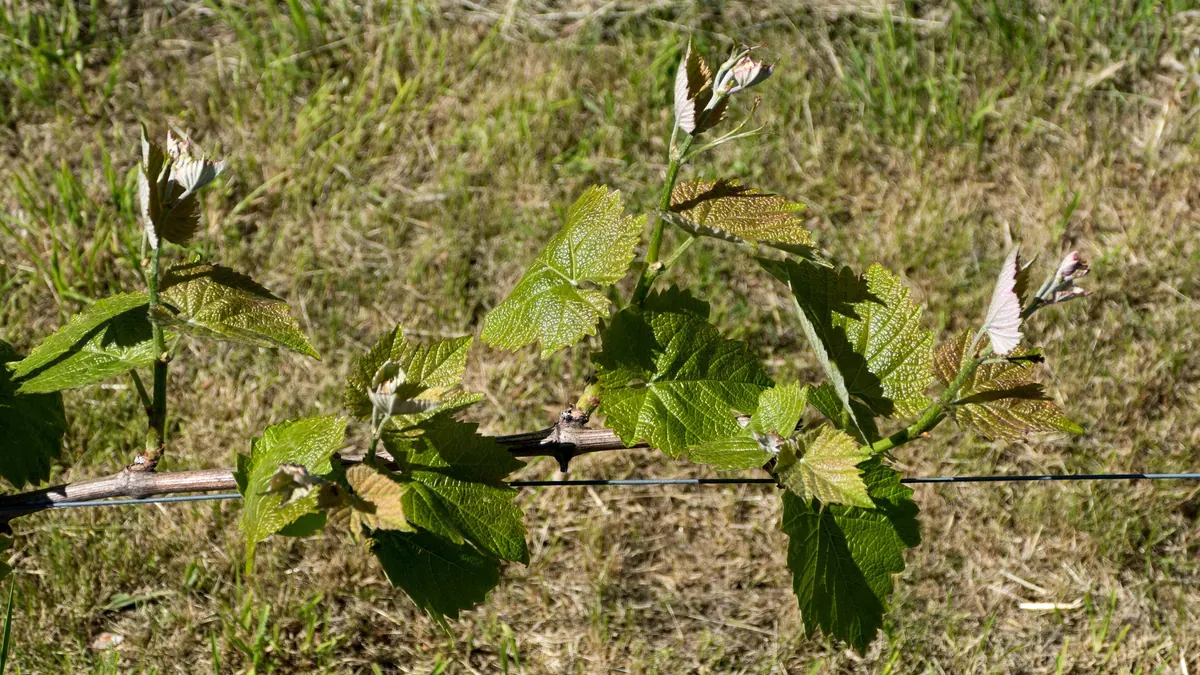
Grapevine leaves — BMP: 2 studies, weighted mean 292 m³ CH₄/t VS
292 m³ CH₄/t VS weighted mean from 2 studies
≈52 %