

BMP testingFruit, vegetables and their residuessingle study (3 samples)
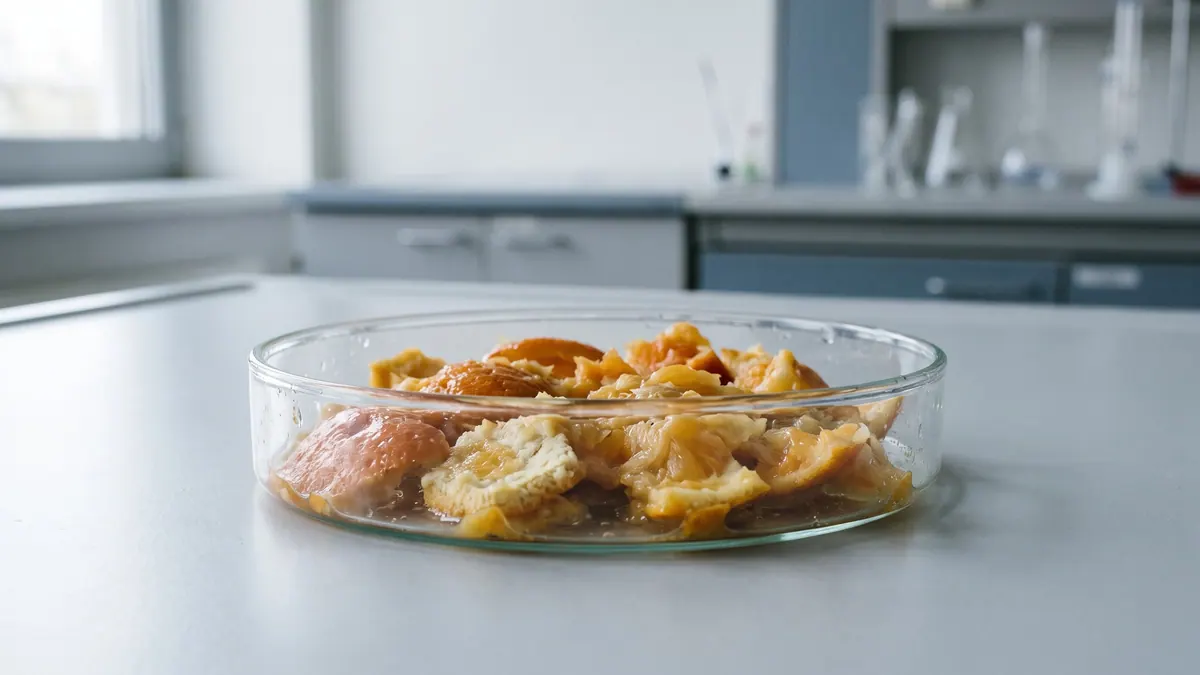
Citrus pressings — BMP: 3 studies, weighted mean 469 m³ CH₄/t VS
Pomace from mandarins, lemons and oranges is a juice-plant waste containing peel, pulp and membranes; rich in pectins, but it contains oils that inhibit digestion.
Illustration: FeedstockData (AI, Google Gemini)
- Weighted mean
- 469m³ CH₄/t VS
- Range
- 433–502m³ CH₄/t VS
- Records
- 3single study (3 samples)
- Publications
- 1source
- Temperatures
- 35 °Cof the test
Methane in biogas
Medium methane content · ≈ 5.2 kWh/m³ of biogas
estimate from the substrate type The collected studies contain no measurement. The interval follows from the approximate composition (carbohydrate-dominated (no protein or fat characteristics)) and the yields of compound groups according to FNR.
Rating for biogas plants
not rated — editorial rating for biogas plants
Not rated: no dry matter or volatile solids in the data. We calculate the rating when the dry matter and volatile solids of the material are known.
Add to the co-digestion calculator CSV data
BMP curves from 3 studies
Weighted mean Individual records
Dashed lines are a model curve (first-order kinetics, B(t) = B₀·(1 − e−kt)); the end point comes from the publication. All curves are model curves.
Cumulative methane production over the test [m³ CH₄/t VS]. The thick line is the weighted mean of all records (469); dots mark the end values given in the publications. Point at the chart to read values; click a legend item to hide or show a record.
Records and sources
Download CSV| Source | BMP m³ CH₄/t VS | Temperature | Sample | Curve |
|---|---|---|---|---|
| Gunaseelan (2004) · 1 DOI | 433 | 35 °C · mesophilic | Mandarin pressing | end point (model curve) |
| Gunaseelan (2004) · 2 DOI | 473 | 35 °C · mesophilic | lemon pressings | end point (model curve) |
| Gunaseelan (2004) · 3 DOI | 502 | 35 °C · mesophilic | citrus sinesis pressings | end point (model curve) |
| Weighted mean | 469 | arithmetic mean 469, SD 35 | ||
Typical composition
- Volatile solids (VS)
- 96.8 % DM (range 92.3–97.4)
Median and range of the determinations reported in the publications behind this substrate's BMP records (read from: MY-D); dry matter: 0 determinations, volatile solids: 3 determinations. No DM in the sources – the calculator has to ask for a value.
Sources: Gunaseelan (2004).
The composition of the raw material varies between batches — for plant calculations use an analysis of your own sample. The calculator inserts typical values automatically.
Process properties
Low confidence: the description is based on general characteristics of the substrate group, not on studies of this material. Treat it as a hint to be verified.
Advantages
- Methane yield in the compendium: median 473 (range 433–502) m³ CH₄/t VS, 3 records from 1 papers (weighted mean 469).
- Strategies for removing the inhibitory limonene (extraction, fungal pretreatment) are described in the literature (Ruiz and Flotats (2014))
Drawbacks and risks
- Citrus essential oils may inhibit digestion; divergent values have been reported for the limonene threshold dose (24–192 mg oil/l reactor·d) (Ruiz and Flotats (2014))
- Limonene is an antimicrobial agent that hinders biogas production from orange peel (Wikandari et al. (2015))
Co-digestion — what to combine it with, what to watch out for
- caution
Pomace and peel contain the same inhibitory limonene — their shares must be counted together.[1]
- caution
substrates: contains inhibitors — e.g. Pulp and paper mill biosludge, Spent coffee grounds, Sargassum biomass, Pig slurry, Municipal sewage sludge (mixed)
Citrus limonene is described as an inhibitor; according to the review by Chen et al., inhibitors (ammonia, sulphides, metal ions, organic compounds) are the main cause of digestion failures, so accumulation with other substrates carrying this tag should be monitored.[1][2]
Dosing
Review by Ruiz and Flotats (2014): for a stable process the limonene threshold dose was reported inconsistently, in the range of 24–192 mg citrus oil per litre of reactor per day. This is a dose of oil, not a mass share of the substrate, so max_share remains empty.
Introduce gradually, starting with a small dose and monitoring the process (e.g. FOS/TAC, pH, gas composition).
Practical requirements
- Remove or recover limonene before digestion (extraction, fungal pretreatment); hexane leaching increased production more than threefold, but residual hexane reduced methane production by 28.6% (Ruiz and Flotats (2014); Wikandari et al. (2015))
- Adding biochar shortened the lag phase of citrus peel (7.5–9.4 days depending on the proportion) (Fagbohungbe et al. (2016))
Sources of the process data
- Citrus essential oils and their influence on the anaerobic digestion process: an overview
- Inhibition of anaerobic digestion process: A review
- Biochemical methane potential of fruits and vegetable solid waste feedstocks
- Improvement of Biogas Production from Orange Peel Waste by Leaching of Limonene
- Impact of biochar on the anaerobic digestion of citrus peel waste
The co-digestion calculator will assess a specific mixture containing this substrate.
What it is and where it comes from
Citrus pomace is a solid waste generated in the industrial production of orange, mandarin, lemon and grapefruit juices. It consists of peel, segment membranes, remains of pulp and seeds. It is usually dried and sold as feed or as a raw material for the production of pectins and oils. In Poland citrus fruits are exclusively imported, so the waste occurs at juice plants and processing facilities, and on a national scale the stream is small.
Properties relevant to digestion
The pomace contains pectins, hemicellulose, cellulose and soluble sugars, with low lignin. It is characterised by an acidic reaction, which lowers the pH of the feed, and by the presence of essential oils, mainly D-limonene, with antimicrobial action. The amount of oil depends on whether the peel was cold-pressed, steamed or subjected to stripping. The hydrolysis of pectins is rapid and leads to the release of galacturonic acid and methanol, which at high doses increases the risk of acidification. The pomace is often wet and prone to mould.
How to read the spread of results
The set contains several records from one source, describing mandarin, lemon and orange pomace under mesophilic conditions. The results are similar, but this is only one study, so it does not reflect variability between plants and pressing methods. The result is affected by the species, the juice extraction technology, the amount of residual oil, particle size, moisture, the inoculum and the substrate-to-inoculum ratio. Too high a load may cause inhibition and understate the result.
In biogas plant practice
Citrus pomace is used in a limited share in a mixture with slurry or sludge. Shredding is not usually needed, but even dosing and pH monitoring are important. In installations that receive it regularly, adaptation of the microflora to limonene is advisable. The material moulds quickly, so it should not be stored for long without preservation; ensiling or drying changes its properties. Waste from the juice industry is waste and requires appropriate permits for the installation.
When planning the recipe, it is worth remembering that dried pomace, sold as feed or as a raw material for pectin extraction, has a different composition from fresh pomace straight from the press: it loses part of its volatile oils, but retains the pectin fibre. The result for one form therefore does not always describe the other.
Methodology in brief
BMP is the amount of methane obtained from volatile solids (VS) in a batch test, given in m³ CH₄ per tonne of VS (numerically the same as NmL CH₄/g VS in the publications) and converted to normal conditions (0 °C, 101.325 kPa). The weighted mean gives each publication a total weight of 1, split equally between its results for the substrate — a paper testing twenty varieties does not outweigh a paper with a single sample. In inter-laboratory programmes the unit is the laboratory (total weight 1), and within it the weight of a test grows with the number of bottles (replicates). Results after pretreatment (e.g. thermal, chemical, enzymatic) are shown separately and are not included in the mean.
Solid lines are curves measured in the tests. Where a publication gives only the final result, we draw a first-order kinetic model, B(t) = B₀·(1 − e−kt): only the end point comes from the publication, and the shape of the curve serves purely as visualisation — do not read the production on a particular day from it. For this substrate k = 0.245 d−1 was assumed (median of rate constants k reported in the sources and/or fitted to the mean measured curves).
The statistics describe the spread of published results — a descriptive compilation, not a meta-analysis or a guarantee of plant yield.
Bibliography
- Gunaseelan, V. (2004). Biochemical methane potential of fruits and vegetable solid waste feedstocks. Biomass and Bioenergy 26(4), 389–399. DOI: 10.1016/j.biombioe.2003.08.006 DOI
All sources of the site: bibliography.
Other substrates in the group “Fruit, vegetables and their residues”
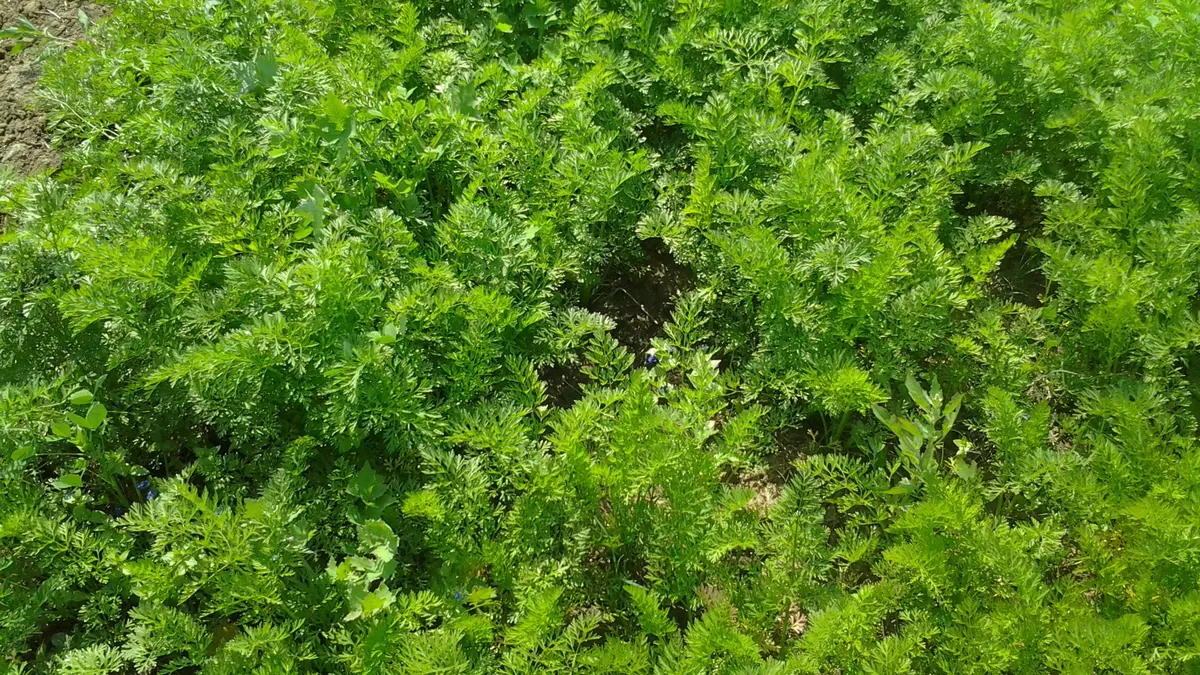
Carrot tops (leaves and petioles) — BMP: 2 studies, weighted mean 275 m³ CH₄/t VS
275 m³ CH₄/t VS weighted mean from 2 studies
≈52 %
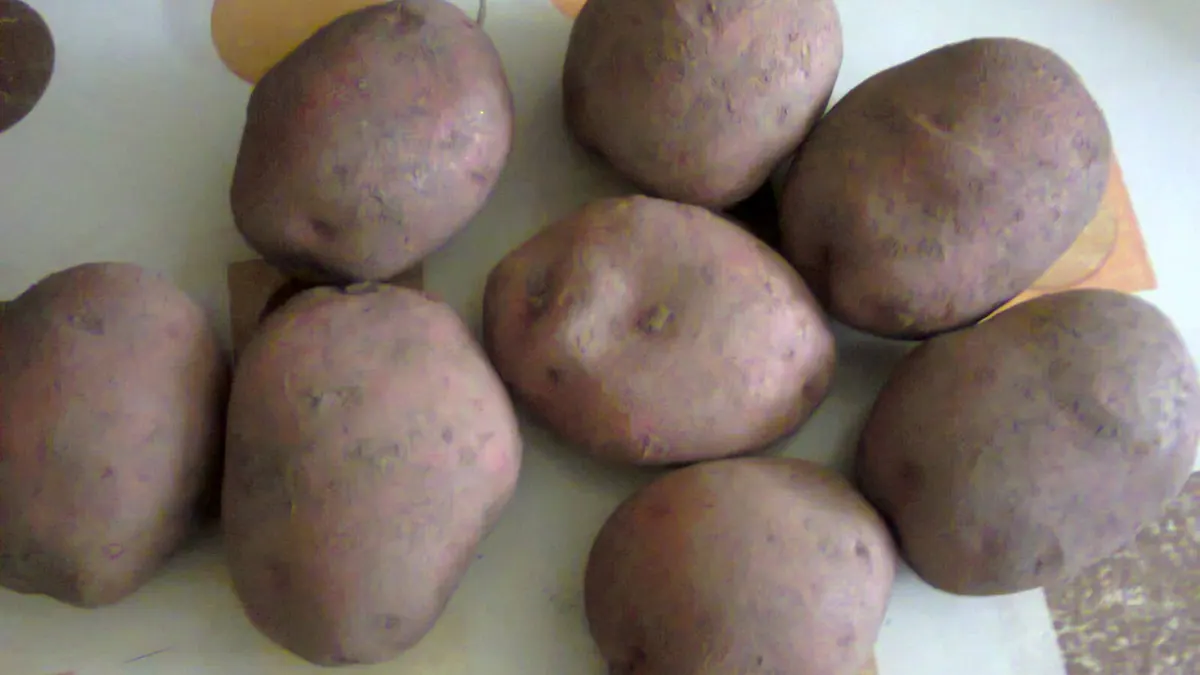
Potatoes (tubers) — BMP: 5 studies, weighted mean 376 m³ CH₄/t VS
376 m³ CH₄/t VS weighted mean from 5 studies
≈53 %
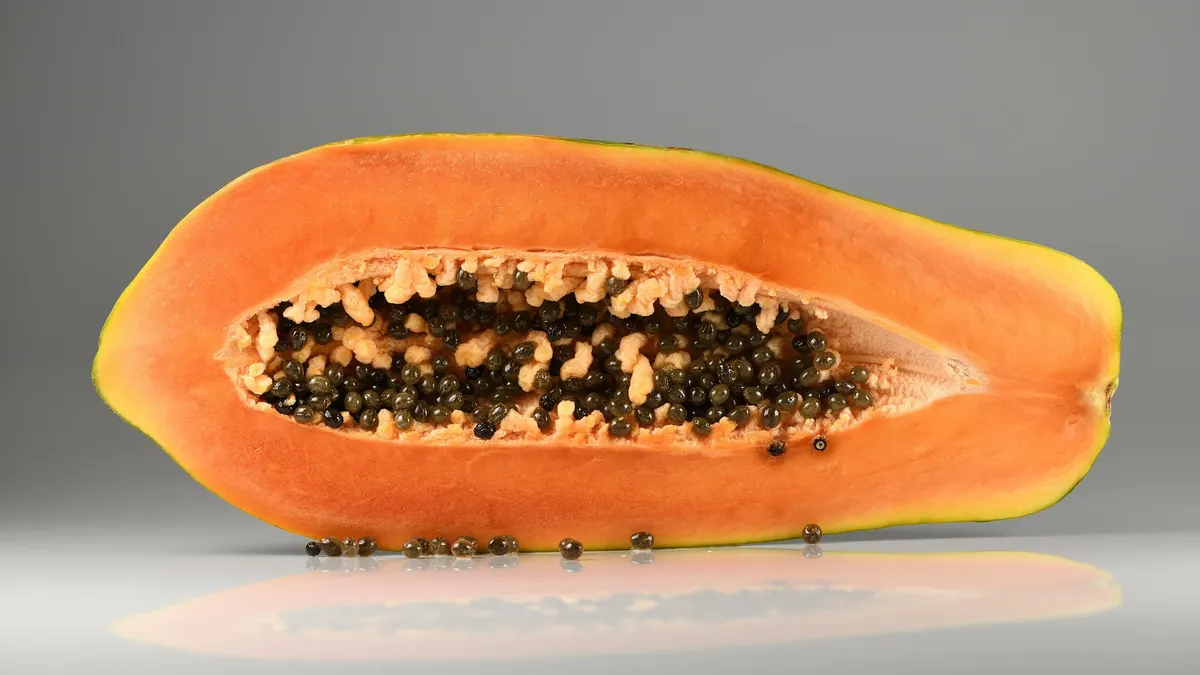
Whole tropical fruit (papaya, mango) — BMP: 2 studies, weighted mean 333 m³ CH₄/t VS
333 m³ CH₄/t VS weighted mean from 2 studies
neutral — editorial rating for biogas plants≈56 %
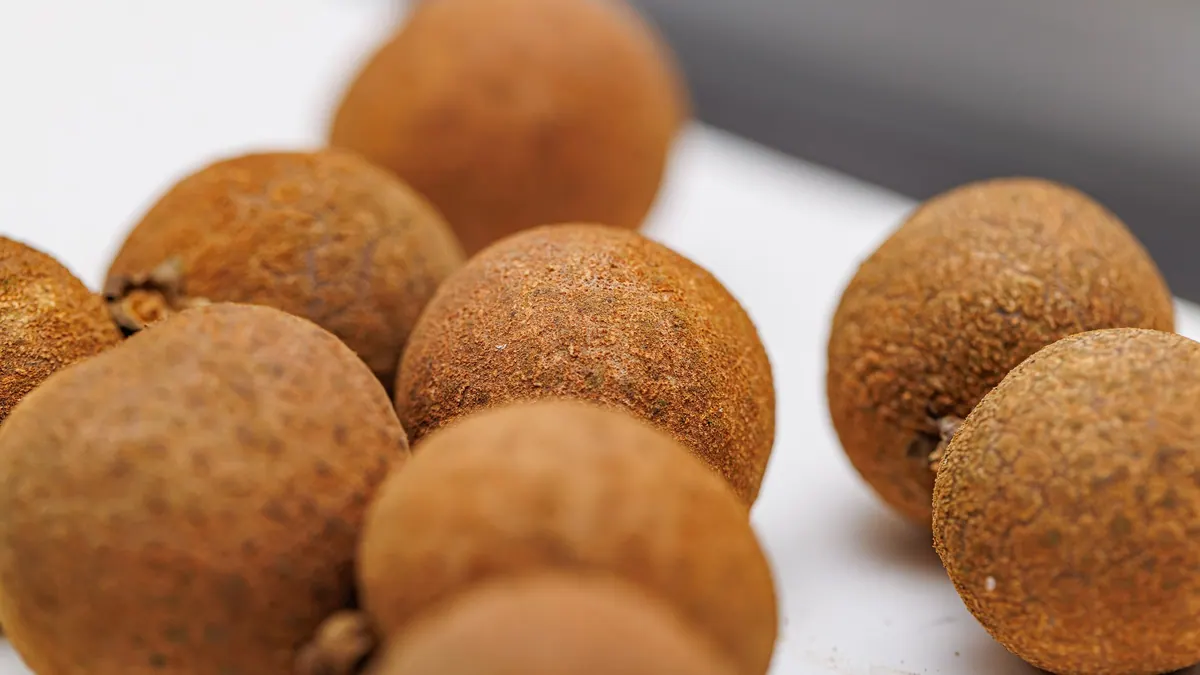
Longan peel, seed and waste — BMP: 3 studies, weighted mean 190 m³ CH₄/t VS
190 m³ CH₄/t VS weighted mean from 3 studies
≈52 %