

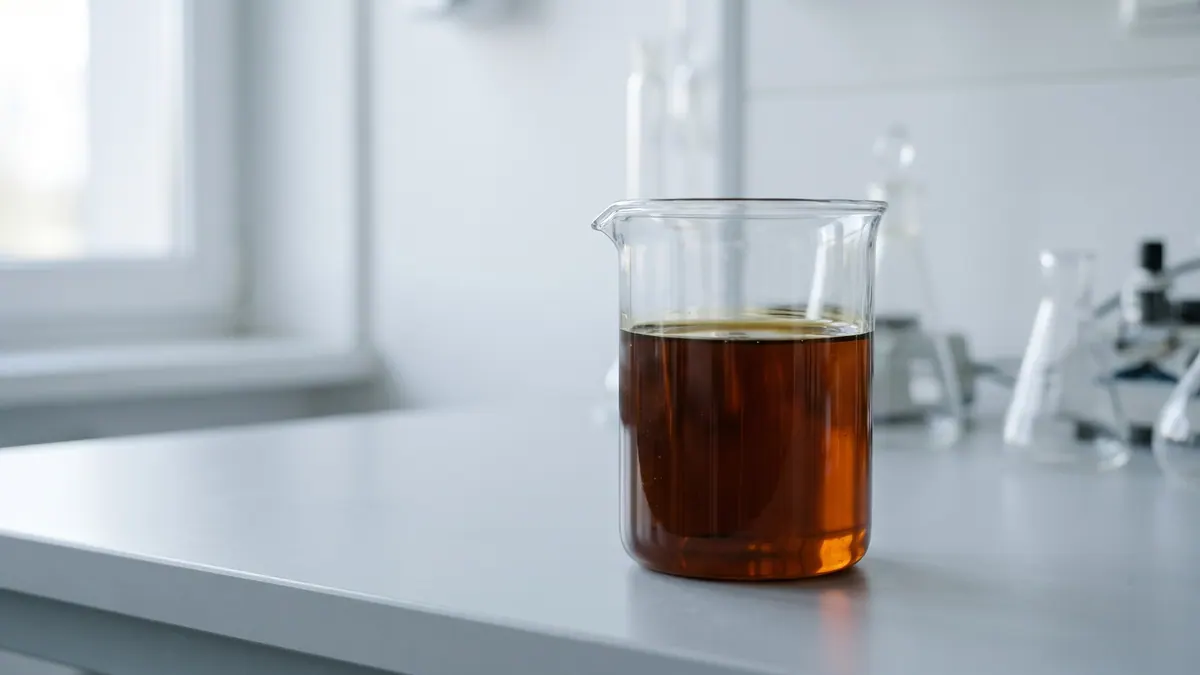
BMP testingBy-products of the agri-food industrysingle study (2 samples)
Crude glycerol — BMP: 2 studies, weighted mean 426 m³ CH₄/t VS
Crude glycerol from biodiesel production is a very readily degradable substrate (370-483 m³ CH₄/t VS in one study) which in co-digestion requires small, continuous doses: the calculator warns above 6% of the fresh mass of the feed.
rating: goodCH₄ ≈ 52 % (estimate)
Illustration: FeedstockData (AI, Google Gemini)
- Weighted mean
- 426m³ CH₄/t VS
- Range
- 370–483m³ CH₄/t VS
- Records
- 2single study (2 samples)
- Publications
- 1source
- Temperatures
- —of the test
Methane in biogas
Medium methane content · ≈ 5.2 kWh/m³ of biogas
estimate from the substrate type The collected studies contain no measurement. The interval follows from the approximate composition (carbohydrate-dominated (no protein or fat characteristics)) and the yields of compound groups according to FNR.
Rating for biogas plants
good — editorial rating for biogas plantsStable, usually accepted without a fee
Potential per tonne of fresh matter: very high (147 m³ CH₄/t); process risk: foaming, acidification. No additional handling requirements.
Why? Rating factors
Potential per tonne +3
- +3potential 147 m³ CH₄/t fresh matter (FNR (2013), Guía sobre el Biogás, Tabla 4.9: crude glycerine 147 m³ CH₄/t FM (according to FNR the values vary widely in practice))
Process stability −0.75
- −0.5foaming: tendency to form foam in the digester
- −0.25acidification: rapid degradation / acidic pH, risk of VFA accumulation, needs buffering
Handling and costs 0
- 0no factors
Total points: 2.25 · thresholds: ≥ 2.5 very good, ≥ 1 good, below — neutral; negative with cumulative process risk.
Add to the co-digestion calculator CSV data
BMP curves from 2 studies
Weighted mean Individual records
Dashed lines are a model curve (first-order kinetics, B(t) = B₀·(1 − e−kt)); the end point comes from the publication. All curves are model curves.
Cumulative methane production over the test [m³ CH₄/t VS]. The thick line is the weighted mean of all records (426); dots mark the end values given in the publications. Point at the chart to read values; click a legend item to hide or show a record.
Records and sources
Download CSV| Source | BMP m³ CH₄/t VS | Temperature | Sample | Curve |
|---|---|---|---|---|
| Jensen et al. (2014) · 1 DOI | 370 | — | Crude glycerol, sample with the lowest methane potential | end point (model curve) |
| Jensen et al. (2014) · 2 DOI | 483 | — | Crude glycerol, sample with the highest methane potential | end point (model curve) |
| Weighted mean | 426 | arithmetic mean 426, SD 80 | ||
Process properties
Advantages
- Methane potential: 370-483 m³ CH₄/t VS: extreme values from several samples in one study (Jensen et al. 2014).
- In co-digestion with slurry it increased biogas production: good results at 4% (meso) and 3% (thermo) glycerol (Astals et al. 2012, 2013).
- In a study with sewage sludge, a dose of up to 2% v/v increased the organic loading by 70% and methane production by 50% (Jensen et al. 2014).
Drawbacks and risks
- Very easily degradable: the main inhibition mechanism is overload by rapid fermentation (acids), IC50 1.01 g VS/L (Jensen et al. 2014).
- Above 8% of the fresh matter of the feed the co-digestion effect disappears and inhibition is possible (FNR 2010); in a sewage sludge digester above 1% v/v there is severe disturbance (Fountoulakis et al. 2010).
- Crude glycerine may contain over 20% methanol, which inhibits methanogens (FNR 2010); the methanol and salt content depends on the batch.
- One publication and an undisclosed number of samples: the spread of 370-483 m³/t is not broken down by cause (Jensen et al. 2014).
Co-digestion — what to combine it with, what to watch out for
- combines well
substrates: high alkalinity (buffer) — e.g. Cattle manure, Pig slurry, Cattle slurry, Duck slurry, Rumen and digestive tract content
Slurry balances the C/N of glycerol and supplies alkalinity.[1][2]
- avoid
substrates: fat-rich — e.g. Food waste, Spent coffee grounds, Primary sludge, Sunflower seeds, Olive pomace / olive mill solid waste
Glycerine + fats/oils: adding up of the easily degradable load and LCFA: risk of overload and foaming.[3]
Dosing
Indicative limit from the literatureup to 6% fresh mass of the feed[4][1][2]
As for residual glycerine: FNR (2010): up to a max. of 6% of fresh matter clear synergy, above 8% no effect and possible inhibition; Astals et al. (2012, 2013): 4% (meso) and 3% (thermo) with pig slurry. In a sewage sludge digester the limit is about 1% v/v (Fountoulakis et al. 2010); Jensen et al. (2014) worked up to 2% v/v without synergy, but with an increase in loading. Start from 1-2%, dose continuously.
Introduce gradually, starting with a small dose and monitoring the process (e.g. FOS/TAC, pH, gas composition).
Practical requirements
- Continuous dosing in small portions, not all at once
- Monitor FOS/TAC and foam when increasing the dose (Jensen et al. 2014)
Sources of the process data
- Astals et al. (2012). Anaerobic co-digestion of pig manure and crude glycerol at mesophilic conditions. Bioresour. Technol.
- Astals et al. (2013). Thermophilic co-digestion of pig manure and crude glycerol: process performance and digestate quality. J. Biotechnol.
- Long et al. (2012). Anaerobic co-digestion of fat, oil, and grease (FOG): A review of gas production and process limitations. Process Saf. Environ. Prot.
- FNR (2010). Guía sobre el Biogás – Desde la producción hasta el uso (hiszp. wydanie „Leitfaden Biogas”, GIZ 2013)
- Fountoulakis, Petousi, Manios (2010). Co-digestion of sewage sludge with glycerol to boost biogas production. Waste Manag.
- Jensen, Astals, Lu, Devadas, Batstone (2014). Anaerobic codigestion of sewage sludge and glycerol, focusing on process kinetics, microbial dynamics and sludge dewaterability. Water Research 67, 355-366
The co-digestion calculator will assess a specific mixture containing this substrate.
What it is and where it comes from
Crude glycerol (technical glycerol) is a by-product of the transesterification of fats in biodiesel production. It is not pure glycerol: besides it, it contains water, residual methanol, soaps and salts (catalyst residues), and the composition depends on the technology and raw material of the particular producer. The compilation contains two records, both from a single publication: Jensen et al. (2014, Water Research), devoted to the co-digestion of sewage sludge with glycerol. The authors tested several glycerol samples and gave in the abstract only the extreme values: from 370 to 483 m³ CH₄/t VS. The records in the database are therefore the lowest and highest value from among the samples, and not two independent measurements; we do not know which samples stand behind them or how many there were.
Properties relevant to digestion
Glycerol is very readily degradable and poor in nitrogen, so it complements other substrates well, but it can also easily overload the chamber. In Jensen's study the inhibitory concentration IC50 was 1.01 g VS/L, and the main mechanism of inhibition was overloading resulting from rapid fermentation (acids), not the presence of toxic compounds in the glycerol. In systems with pig slurry, good results were obtained at 4% (mesophilic) and 3% (thermophilic) glycerol (Astals et al. 2012, 2013). Crude glycerol may contain over 20% methanol, which at high concentrations inhibits methanogens; this information comes from the FNR guide (2010) and does not apply to every batch. The salt content (sodium, potassium) also depends on the batch and cannot be predicted without analysis.
How to read the spread of results
The difference of 370-483 m³/t is over 30%, with a single publication and an undisclosed number of samples. The spread reflects the variable composition of the batches (content of glycerol, water, methanol and salts), but it cannot be broken down into causes. The mean of 426.5 m³/t is only the midpoint of the interval and should not be used for production planning. For your own batch a BMP test and an analysis of the content of glycerol, methanol and salts are needed.
In biogas plant practice
In the calculator, the dose rules from the sources apply. For agricultural installations with slurry and agricultural biomass, FNR (2010) gives up to 6% of the fresh mass of the feed as a dose giving a clear improvement in co-digestion, and above 8% no effect and possible inhibition; the calculator therefore warns above 6% and shows high risk above 8%. In a sludge digester the limit is much lower: Fountoulakis et al. (2010) indicated about 1% of the sludge volume, and Jensen et al. (2014) worked up to 2% v/v and found no synergy between sludge and glycerol, only an increase in load and methane production. The dose is introduced gradually, in many small portions, with control of FOS/TAC and foam. Do not combine glycerol with a large dose of fats, because readily degradable loads add up.
Methodology in brief
BMP is the amount of methane obtained from volatile solids (VS) in a batch test, given in m³ CH₄ per tonne of VS (numerically the same as NmL CH₄/g VS in the publications) and converted to normal conditions (0 °C, 101.325 kPa). The weighted mean gives each publication a total weight of 1, split equally between its results for the substrate — a paper testing twenty varieties does not outweigh a paper with a single sample. In inter-laboratory programmes the unit is the laboratory (total weight 1), and within it the weight of a test grows with the number of bottles (replicates). Results after pretreatment (e.g. thermal, chemical, enzymatic) are shown separately and are not included in the mean.
Solid lines are curves measured in the tests. Where a publication gives only the final result, we draw a first-order kinetic model, B(t) = B₀·(1 − e−kt): only the end point comes from the publication, and the shape of the curve serves purely as visualisation — do not read the production on a particular day from it. For this substrate k = 0.091 d−1 was assumed (no kinetic data for the group – the median of all available rate constants k (93 values) was used).
The statistics describe the spread of published results — a descriptive compilation, not a meta-analysis or a guarantee of plant yield.
Bibliography
- Jensen, P.; Astals, S.; Lu, Y.; Devadas, M.; Batstone, D. (2014). Anaerobic codigestion of sewage sludge and glycerol, focusing on process kinetics, microbial dynamics and sludge dewaterability. Water Research 67, 355–366. DOI: 10.1016/j.watres.2014.09.024 DOI
All sources of the site: bibliography.
Other substrates in the group “By-products of the agri-food industry”
Coffee husk — BMP: 3 studies, weighted mean 152 m³ CH₄/t VS
152 m³ CH₄/t VS weighted mean from 3 studies
≈52 %
Grape seeds — BMP: 2 studies, weighted mean 214 m³ CH₄/t VS
214 m³ CH₄/t VS weighted mean from 2 studies
≈52 %
Rapeseed meal and cake — BMP: 2 studies, weighted mean 368 m³ CH₄/t VS
368 m³ CH₄/t VS weighted mean from 2 studies
≈66 %
Sunflower oil cake and meal — BMP: 7 studies, weighted mean 184 m³ CH₄/t VS
184 m³ CH₄/t VS weighted mean from 7 studies
neutral — editorial rating for biogas plants≈64 %