

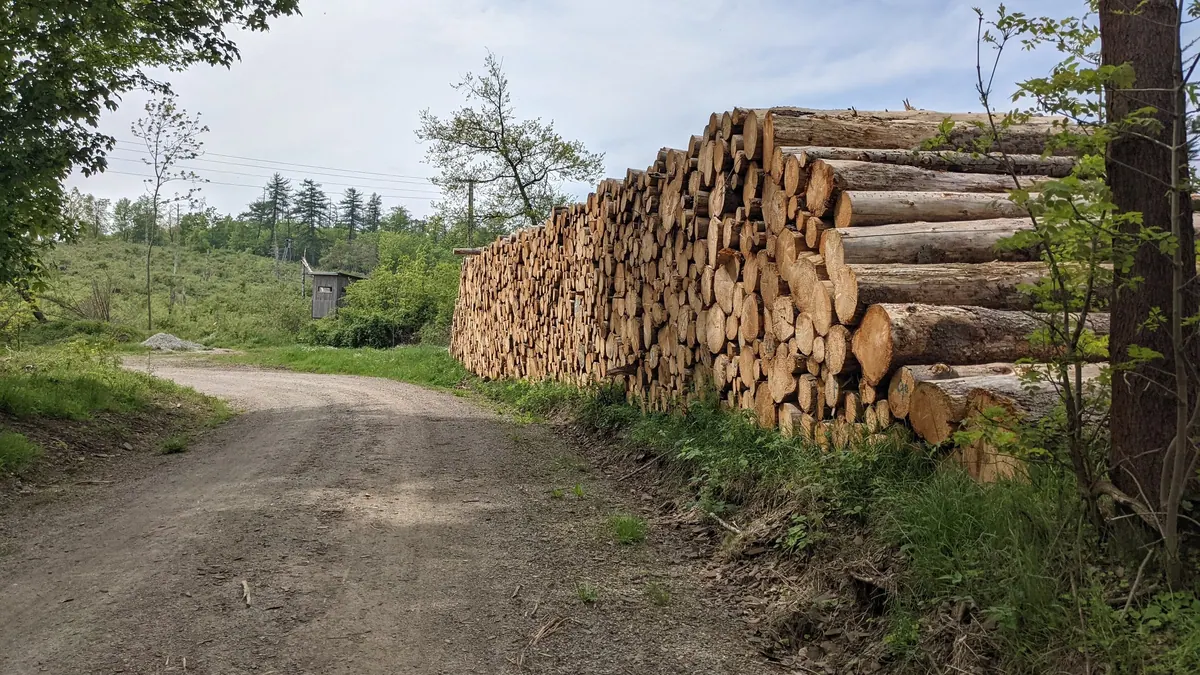
BMP testingWood and woody biomass
Softwood — BMP: 7 studies, weighted mean 58 m³ CH₄/t VS
Softwood (pine, fir and others) has a lot of lignin and resins, so it degrades slowly and poorly in the digester, especially without pretreatment.
rating: neutralCH₄ ≈ 52 % (estimate)
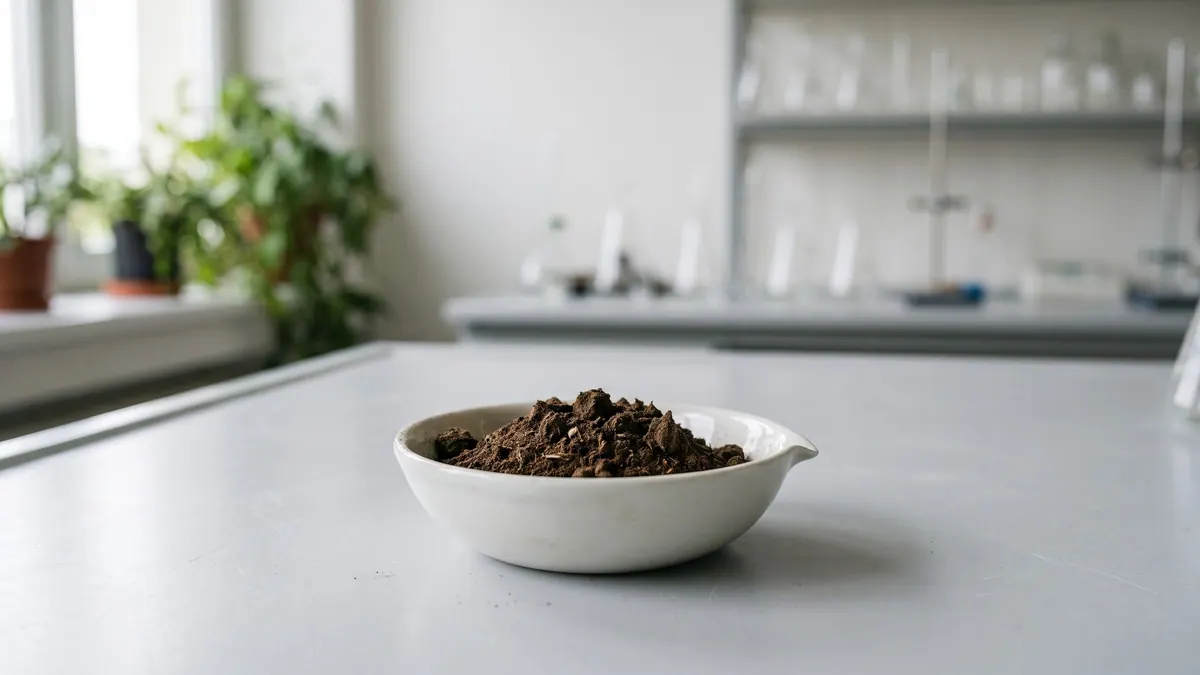
Photo Profpcde / Wikimedia Commons, licence CC0 1.0, source file; changes: cropping

- Weighted mean
- 58m³ CH₄/t VS
- Range
- 35–86m³ CH₄/t VS
- Records
- 7studies
- Publications
- 4sources
- Temperatures
- 35 °C, 55 °Cof the test
Methane in biogas
Medium methane content · ≈ 5.2 kWh/m³ of biogas
estimate from the substrate type The collected studies contain no measurement. The interval follows from the approximate composition (carbohydrate-dominated (no protein or fat characteristics)) and the yields of compound groups according to FNR.
Rating for biogas plants
neutral — editorial rating for biogas plantsNo clear advantages — worth charging a fee for accepting it
Potential per tonne of fresh matter: low, but limited by the poor degradability of the organic matter (52 m³ CH₄/t); no particular threats to stability. Handling costs: fibres, floating layer, slow degradation.
Why? Rating factors
Potential per tonne 0
- ±0potential 52 m³ CH₄/t fresh matter (BMP 58 × DM 91.8 % × VS 98.7 %); low degradability of VS (BMP 58 m³ CH₄/t VS) — points capped
Process stability 0
- 0no factors
Handling and costs −1
- −0.5fibres, floating layer — shredding and intensive mixing
- −0.5slow degradation — long retention time
Total points: −1 · thresholds: ≥ 2.5 very good, ≥ 1 good, below — neutral; negative with cumulative process risk.
Add to the co-digestion calculator CSV data
BMP curves from 7 studies
Weighted mean Individual records
Dashed lines are a model curve (first-order kinetics, B(t) = B₀·(1 − e−kt)); the end point comes from the publication. All curves are model curves.
Cumulative methane production over the test [m³ CH₄/t VS]. The thick line is the weighted mean of all records (58); dots mark the end values given in the publications. Point at the chart to read values; click a legend item to hide or show a record.
Records and sources
Download CSV| Source | BMP m³ CH₄/t VS | Temperature | Sample | Curve |
|---|---|---|---|---|
| Tong et al. (1990) DOI | 42 | 35 °C · mesophilic | White fir · pretreatment: air dried | end point (model curve) |
| Chynoweth et al. (1993) DOI | 59 | 35 °C · mesophilic | Pine | end point (model curve) |
| Krause et al. (2018) · 1 DOI | 35 | 35 °C · mesophilic | softwood | end point (model curve) |
| Krause et al. (2018) · 2 DOI | 37 | 55 °C · thermophilic | softwood | end point (model curve) |
| Krause et al. (2018) · 3 DOI | 47 | 55 °C · thermophilic | softwood | end point (model curve) |
| Krause et al. (2018) · 4 DOI | 55 | 35 °C · mesophilic | softwood | end point (model curve) |
| Costa et al. (2019) DOI | 86 | — | Spruce (milled wood) | end point (model curve) |
| Weighted mean | 58 | arithmetic mean 52, SD 18 | ||
Typical composition
- Dry matter (DM)
- 91.8% (range 88.8–94.7)
- Volatile solids (VS)
- 98.7 % DM (range 98.5–98.8)
Median and range of the determinations reported in the publications behind this substrate's BMP records (read from: CROPGEN D4, MY-D); dry matter: 2 determinations, volatile solids: 2 determinations. Samples were tested dried/air-dry – the DM refers to the material in the test, not to fresh material.
Sources: Tong et al. (1990); Krause et al. (2018).
The composition of the raw material varies between batches — for plant calculations use an analysis of your own sample. The calculator inserts typical values automatically.
Process properties
Advantages
- Methane potential in the database: weighted mean 58 m³ CH₄/t VS (median 47; range 35-86; 7 records from 4 sources).
- Pretreatment (steam, alkaline, mechanical) increases the availability of cellulose and is the only route to a sensible result (review by Hendriks and Zeeman 2009).
Drawbacks and risks
- Spread of results in the database: standard deviation 18 at a mean of 52 m³ CH₄/t VS (7 records from 4 sources).
Co-digestion — what to combine it with, what to watch out for
- caution
substrates: easily degradable — e.g. Maize silage (whole crop), Food waste, Sorghum, whole crop, Whey, Beet leaves and tops
Easily degradable co-substrates will acidify the system faster than the wood can degrade: dose separately and gradually.[1]
Dosing
No source dose limits. Without pretreatment this is not a recommended digestion substrate; if used, then as a small additive to mixtures with excreta and after shredding.
Practical requirements
- Shred: shredding increases the surface available for degradation and speeds it up, but does not necessarily raise the final gas yield (FNR 2010, Ch. 3 “Triturado”).
- Remove foreign contaminants before dosing: material from biowaste may contain interfering substances, and the co-substrate should be free of them (FNR 2010, Ch. 3).
Sources of the process data
- Chen, Y.; Cheng, J.J.; Creamer, K.S. (2008) Inhibition of anaerobic digestion process: A review. Bioresource Technology
- Tong, X.; Smith, L.H.; McCarty, P.L. (1990) Methane fermentation of selected lignocellulosic materials. Biomass 21(4), 239–255
- Chynoweth, D.; Turick, C.; Owens, J.; Jerger, D.; Peck, M. (1993) Biochemical methane potential of biomass and waste feedstocks. Biomass and Bioenergy 5(1), 95–111
- Hendriks, A.T.W.M.; Zeeman, G. (2009) Pretreatments to enhance the digestibility of lignocellulosic biomass. Bioresource Technology
- Krause, M.J.; Chickering, G.W.; Townsend, T.G.; Pullammanappallil, P. (2018) Effects of temperature and particle size on the biochemical methane potential of municipal solid waste components. Waste Management 71, 25–30
- Costa, T.H.F.; Eijsink, V.G.H.; Horn, S.J. (2019) The use of lytic polysaccharide monooxygenases in anaerobic digestion of lignocellulosic materials. Biotechnology for Biofuels 12(1), 270
- Weiland, P. (2010) Biogas production: current state and perspectives. Applied Microbiology and Biotechnology
- FNR (2010). Guía sobre el Biogás – Desde la producción hasta el uso (hiszp. wydanie „Leitfaden Biogas”, GIZ 2013)
The co-digestion calculator will assess a specific mixture containing this substrate.
What it is and where it comes from
Softwood is biomass from species such as pine, spruce, fir and larch. It arises in forestry and the wood industry as sawn timber, production waste, sawdust, wood chips and branches. The dataset contains samples of specific species (including fir and pine) and samples described generally as softwood, tested under mesophilic and thermophilic conditions.
Properties relevant to digestion
Wood consists of cellulose, hemicelluloses and lignin. Lignin forms a matrix surrounding the cellulose fibres, is practically non-degradable under anaerobic conditions and physically blocks enzymes from accessing carbohydrates. In softwood there is usually more lignin, and its structure, based mainly on guaiacyl units, is more resistant than in hardwood. In addition, resins, terpenes and other extractives can inhibit bacteria and archaea. As a result, the biodegradable part of the volatile solids is small and degradation is slow. There is very little nitrogen, which gives a high C/N ratio.
How to read the spread of results
Differences between records result from the species, the age of the tree, the part of the tree (wood, bark, branches) and size reduction: fine dust degrades faster than wood chips. Test temperature, test length (with slow degradation a short test underestimates the result) and the inoculum also matter. For conifers there is the added effect of extractives and resin content, which varies with the species, the season and the place of harvest. The dataset combines samples described in detail with samples described only generally, which further widens the spread.
In biogas plant practice
Softwood is not a rational biogas plant substrate: poor conversion and difficult degradation do not offset the cost of size reduction. If it reaches an installation, it is as a contaminant or a component of bedding, and its share must be taken into account when setting the retention time. Any application requires thorough size reduction and pretreatment. Wood waste is used for energy mainly by combustion, and its legal status depends on its origin and on whether it is a waste or a by-product.
It is also worth distinguishing wood from bark and needles, which have a different composition: bark contains more tannins and phenolic substances, and needles and young growth contain more readily available compounds, but also essential oils. In practice the result for the whole stream depends on the proportions of these fractions, which further hinders the transfer of literature data to a specific installation.
Methodology in brief
BMP is the amount of methane obtained from volatile solids (VS) in a batch test, given in m³ CH₄ per tonne of VS (numerically the same as NmL CH₄/g VS in the publications) and converted to normal conditions (0 °C, 101.325 kPa). The weighted mean gives each publication a total weight of 1, split equally between its results for the substrate — a paper testing twenty varieties does not outweigh a paper with a single sample. In inter-laboratory programmes the unit is the laboratory (total weight 1), and within it the weight of a test grows with the number of bottles (replicates). Results after pretreatment (e.g. thermal, chemical, enzymatic) are shown separately and are not included in the mean.
Solid lines are curves measured in the tests. Where a publication gives only the final result, we draw a first-order kinetic model, B(t) = B₀·(1 − e−kt): only the end point comes from the publication, and the shape of the curve serves purely as visualisation — do not read the production on a particular day from it. For this substrate k = 0.039 d−1 was assumed (median of rate constants k reported in the sources and/or fitted to the mean measured curves).
The statistics describe the spread of published results — a descriptive compilation, not a meta-analysis or a guarantee of plant yield.
Bibliography
- Tong, X.; Smith, L.H.; McCarty, P.L. (1990). Methane fermentation of selected lignocellulosic materials. Biomass 21(4), 239–255. DOI: 10.1016/0144-4565(90)90075-u DOI
- Chynoweth, D.; Turick, C.; Owens, J.; Jerger, D.; Peck, M. (1993). Biochemical methane potential of biomass and waste feedstocks. Biomass and Bioenergy 5(1), 95–111. DOI: 10.1016/0961-9534(93)90010-2 DOI
- Krause, M.J.; Chickering, G.W.; Townsend, T.G.; Pullammanappallil, P. (2018). Effects of temperature and particle size on the biochemical methane potential of municipal solid waste components. Waste Management 71, 25–30. DOI: 10.1016/j.wasman.2017.11.015 DOI
- Costa, T.H.F.; Eijsink, V.G.H.; Horn, S.J. (2019). The use of lytic polysaccharide monooxygenases in anaerobic digestion of lignocellulosic materials. Biotechnology for Biofuels 12(1), 270. DOI: 10.1186/s13068-019-1611-8 DOI
All sources of the site: bibliography.
Other substrates in the group “Wood and woody biomass”
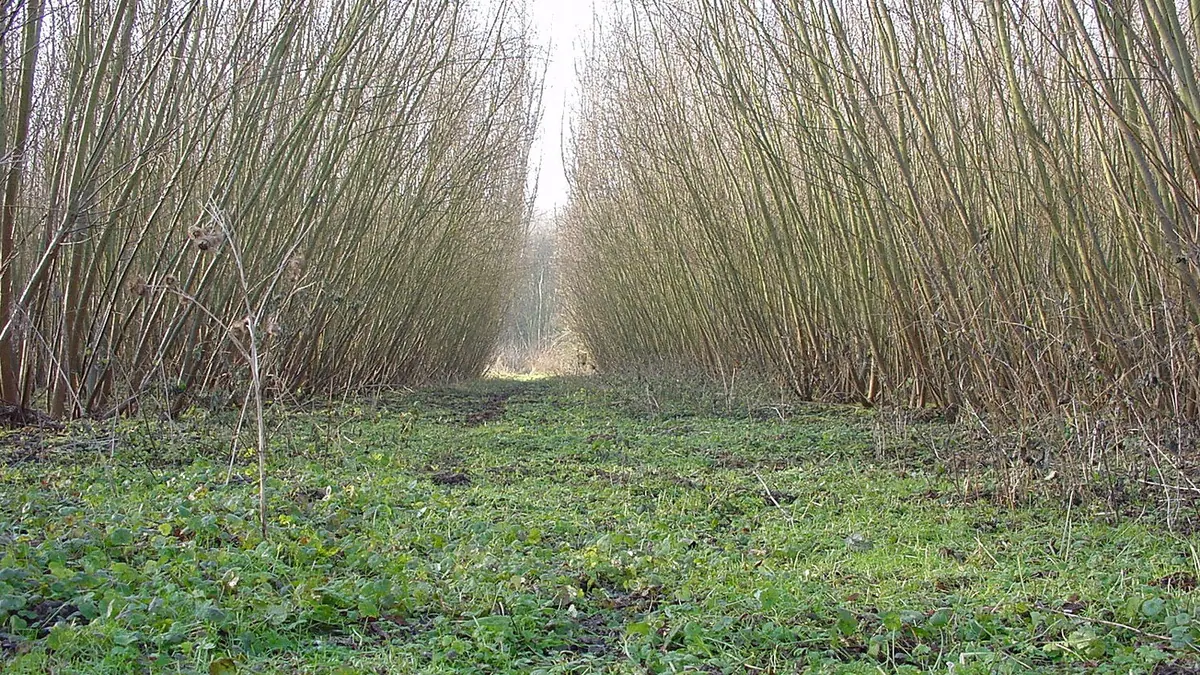
Willow (short rotation) — BMP: 14 studies, weighted mean 259 m³ CH₄/t VS
259 m³ CH₄/t VS weighted mean from 14 studies
≈52 %
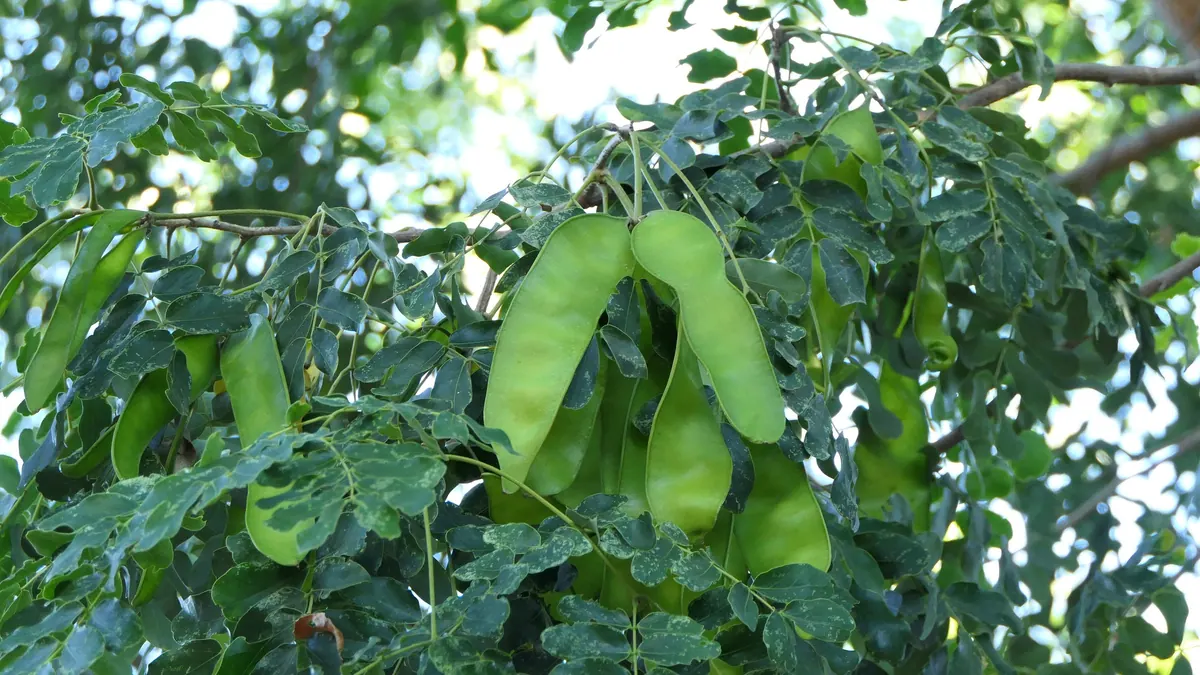
Albizia wood chips and leaves — BMP: 2 studies, weighted mean 137 m³ CH₄/t VS
137 m³ CH₄/t VS weighted mean from 2 studies
neutral — editorial rating for biogas plants≈54 %
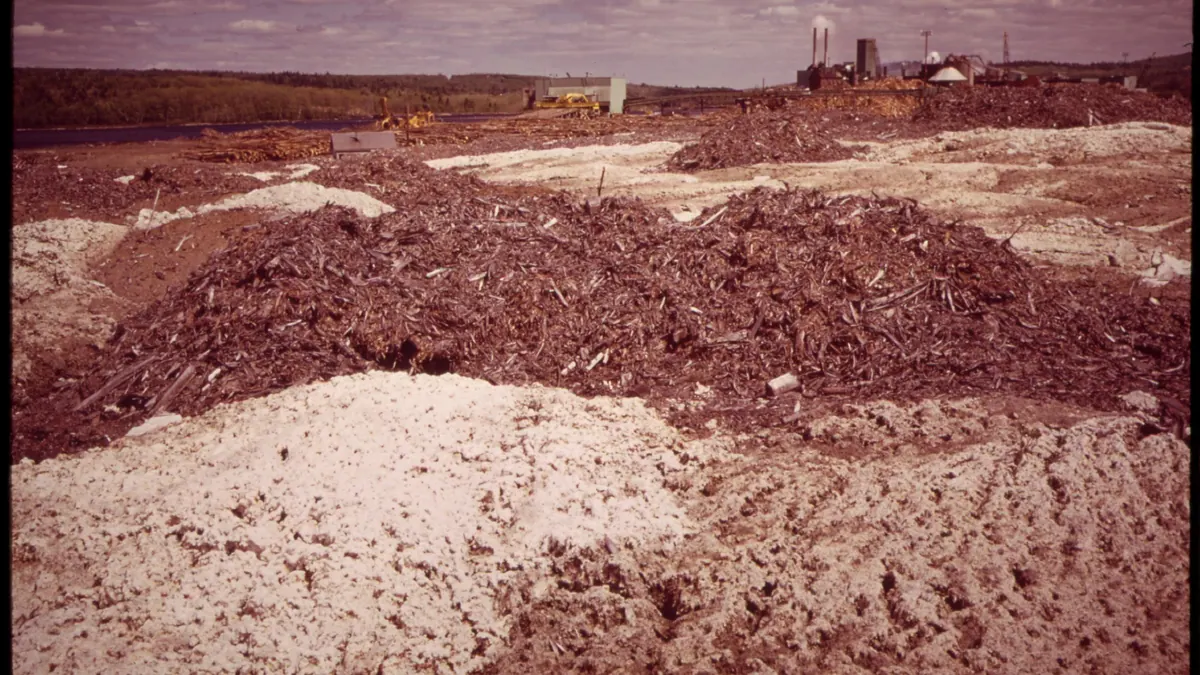
Wood residues from paper industry — BMP: 2 studies, weighted mean 144 m³ CH₄/t VS
144 m³ CH₄/t VS weighted mean from 2 studies
≈52 %
Lignin-rich hydrolysis residue — BMP: 2 studies, weighted mean 105 m³ CH₄/t VS
105 m³ CH₄/t VS weighted mean from 2 studies
≈52 %