

BMP testingAlgae and aquatic plants
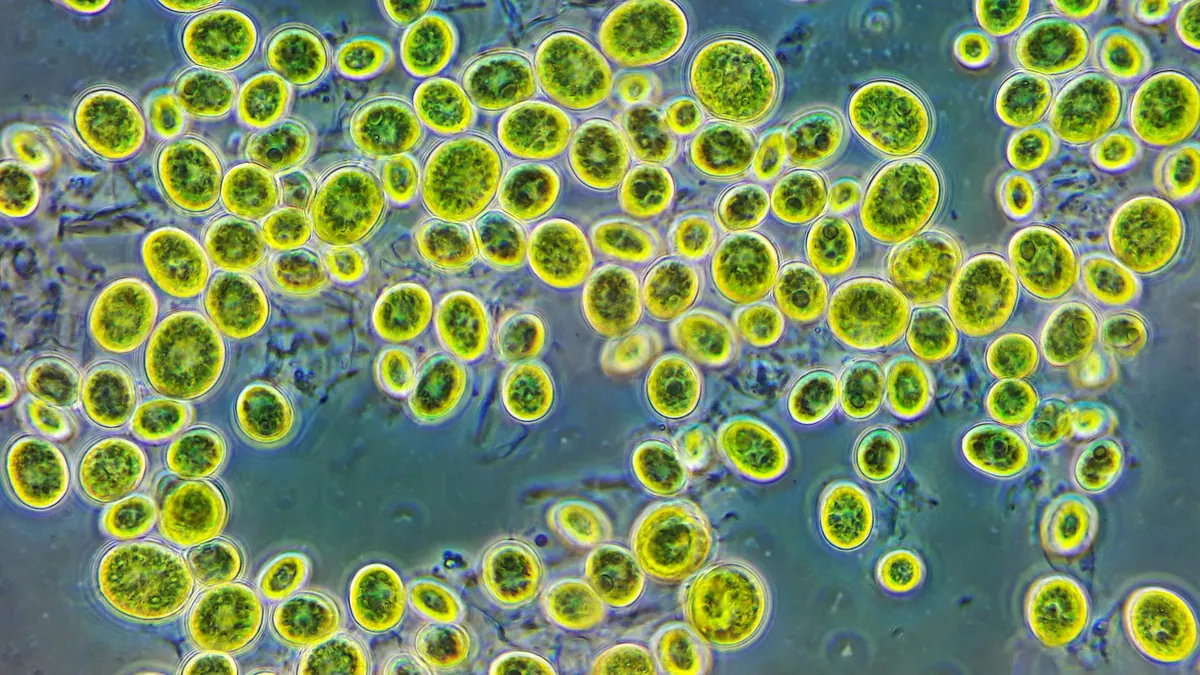
Chlorella sp. — BMP: 4 studies, weighted mean 229 m³ CH₄/t VS
Chlorella sp. with no identified species is a collective entry for samples in which the authors gave only the genus, so the results mix different strains and growing conditions.
Photo Andrei Savitsky / Wikimedia Commons, licence CC BY 4.0, source file; changes: cropping

- Weighted mean
- 229m³ CH₄/t VS
- Range
- 123–339m³ CH₄/t VS
- Records
- 4studies
- Publications
- 4sources
- Temperatures
- 37 °Cof the test
Methane in biogas
Medium methane content · ≈ 5.8 kWh/m³ of biogas
estimate from the substrate type The collected studies contain no measurement. The interval follows from the approximate composition (protein-rich (process classification)) and the yields of compound groups according to FNR.
Rating for biogas plants
not rated — editorial rating for biogas plants
Not rated: no dry matter or volatile solids in the data. We calculate the rating when the dry matter and volatile solids of the material are known.
Add to the co-digestion calculator CSV data
BMP curves from 4 studies
Weighted mean Individual records
Dashed lines are a model curve (first-order kinetics, B(t) = B₀·(1 − e−kt)); the end point comes from the publication. All curves are model curves.
Cumulative methane production over the test [m³ CH₄/t VS]. The thick line is the weighted mean of all records (229); dots mark the end values given in the publications. Point at the chart to read values; click a legend item to hide or show a record.
Records and sources
Download CSV| Source | BMP m³ CH₄/t VS | Temperature | Sample | Curve |
|---|---|---|---|---|
| Fermoso et al. (2016) DOI | 211 | — | Chlorella sorokiniana | end point (model curve) |
| Perendeci et al. (2019) DOI | 242 | — | Chlorella sp. | end point (model curve) |
| He et al. (2016) DOI | 339 | 37 °C · mesophilic | Chlorella sp. | end point (model curve) |
| Jankowska et al. (2017) DOI | 123 | 37 °C · mesophilic | (orig.: “Chlorella”): value quoted in a literature review | end point (model curve) |
| Weighted mean | 229 | arithmetic mean 229, SD 89 | ||
Typical composition
- Dry matter (DM)
- 92.9% (range 92.9–92.9)
- Nitrogen
- 10.4 % DM
- C/N ratio
- 4.4
Median and range of the determinations reported in the publications behind this substrate's BMP records (read from: MY-D); dry matter: 1 determination, volatile solids: 0 determinations. C/N was calculated as the ratio of C and N content (% DM) from the same source. Samples were tested dried/air-dry – the DM refers to the material in the test, not to fresh material.
Sources: He et al. (2016).
The composition of the raw material varies between batches — for plant calculations use an analysis of your own sample. The calculator inserts typical values automatically.
Process properties
Low confidence: the description is based on general characteristics of the substrate group, not on studies of this material. Treat it as a hint to be verified.
Advantages
- Methane yield in the compendium: median 226 (range 123-339) m³ CH₄/t VS, 4 records from 4 studies (weighted mean 229).
- Biological pretreatment of microalgal biomass increased methane production (He et al. (2016))
Drawbacks and risks
- The high protein content of the cells causes release of ammonia, which can be toxic to the process (Sialve et al. (2009); Rajagopal et al. (2013))
Co-digestion — what to combine it with, what to watch out for
- combines well
substrates: carbon-rich — e.g. Wheat straw, Maize silage (whole crop), Cereal straw (unspecified), Willow (short rotation), Cardboard and paperboard
The low C/N of algal sludge was balanced by the addition of paper: 50-60% VS of paper increased the rate of methane production, optimum C/N 20-25.[1][2]
- caution
substrates: nitrogen-rich — e.g. Pig slurry, Poultry manure, Waste activated sludge (secondary sludge), Chlorella vulgaris, Nannochloropsis salina
Algal protein releases ammonia; additional nitrogen sources increase the risk of ammonia inhibition.[2][3]
Dosing
No source limits on the dose for this substrate.
Introduce gradually, starting with a small dose and monitoring the process (e.g. FOS/TAC, pH, gas composition).
Practical requirements
- Do not dry the biomass before feeding: drying lowered biogas production to about 80% (Mussgnug et al. (2010))
- Monitor ammonia (high protein) and, for marine species, sodium (Sialve et al. (2009))
Sources of the process data
- Anaerobic co-digestion of algal sludge and waste paper to produce methane
- Anaerobic digestion of microalgae as a necessary step to make microalgal biodiesel sustainable
- A critical review on inhibition of anaerobic digestion process by excess ammonia
- Screening of biomethane production potential from dominant microalgae
- Correlations between biochemical composition and biogas production during anaerobic digestion of microalgae and cyanobacteria isolated from different sources of Turkey
- Enhanced methane production from microalgal biomass by anaerobic bio-pretreatment
- Biogas from microalgae: Review on microalgae's cultivation, harvesting and pretreatment for anaerobic digestion
- Microalgae as substrates for fermentative biogas production in a combined biorefinery concept
The co-digestion calculator will assess a specific mixture containing this substrate.
What it is and where it comes from
Chlorella is a genus of unicellular green algae, widely used in research and in the production of dietary supplements. This entry collects samples for which the authors did not give the species, but only the genus. It cannot therefore be assumed that they concern a single organism. The biomass is obtained from cultures in ponds, photobioreactors and wastewater treatment systems, and one of the values was quoted in a literature review.
Properties relevant to digestion
Chlorella cells have a rigid cell wall, and in some strains also a resistant biopolymer layer. Without cell disruption, digestive enzymes have difficulty reaching the contents, which limits the rate and degree of conversion. The biomass is rich in protein, so the C/N ratio is low, and the breakdown of proteins releases ammonia, which at a high concentration inhibits methanogenic archaea. The content of lipids and starch depends on the growing conditions, in particular on the availability of nitrogen and light. Biomass from a wastewater treatment plant may also contain admixtures of bacteria and detritus.
How to read the spread of results
The spread is naturally large here: the entry combines samples of unknown species, grown in different media, harvested at different growth phases and prepared in different ways (fresh suspension, freeze-dried material, centrifuged biomass). Additional effects come from cell disruption, test temperature, the substrate-to-inoculum ratio and incubation length. A small number of records is not enough to determine a typical range, and the considerable differences between them do not signify measurement error but the diversity of the materials.
In biogas plant practice
Chlorella is not a substrate used in biogas plants. When algal biomass arises as a by-product, it is worth considering digestion together with material of low nitrogen content in order to limit ammonia, and possibly cell disruption. For plant designers it is important that growing algae for biogas is usually costly, and the cost of concentrating biomass from a dilute suspension may exceed the value of the energy. Legal requirements depend on the origin of the biomass and on the installation's permits.
In interpretation, it is worth remembering that the genus Chlorella comprises many strains with different cell walls and different compositions. Even within a single species the protein content can vary several-fold depending on cultivation, so the lack of species identification is only one of the sources of uncertainty.
Methodology in brief
BMP is the amount of methane obtained from volatile solids (VS) in a batch test, given in m³ CH₄ per tonne of VS (numerically the same as NmL CH₄/g VS in the publications) and converted to normal conditions (0 °C, 101.325 kPa). The weighted mean gives each publication a total weight of 1, split equally between its results for the substrate — a paper testing twenty varieties does not outweigh a paper with a single sample. In inter-laboratory programmes the unit is the laboratory (total weight 1), and within it the weight of a test grows with the number of bottles (replicates). Results after pretreatment (e.g. thermal, chemical, enzymatic) are shown separately and are not included in the mean.
Solid lines are curves measured in the tests. Where a publication gives only the final result, we draw a first-order kinetic model, B(t) = B₀·(1 − e−kt): only the end point comes from the publication, and the shape of the curve serves purely as visualisation — do not read the production on a particular day from it. For this substrate k = 0.102 d−1 was assumed (median of rate constants k reported in the sources and/or fitted to the mean measured curves).
The statistics describe the spread of published results — a descriptive compilation, not a meta-analysis or a guarantee of plant yield.
Results after pretreatment (4) — excluded from the mean
| Source | BMP m³ CH₄/t VS | Pretreatment | Sample |
|---|---|---|---|
| He et al. (2016) | 367 | fermentation | Chlorella sp. |
| He et al. (2016) | 378 | fermentation | Chlorella sp. |
| He et al. (2016) | 390 | fermentation | Chlorella sp. |
| He et al. (2016) | 416 | fermentation | Chlorella sp. |
Bibliography
- Fermoso, F.G.; Beltran, C.; Jimenez, A.; Fernández, M.J.; Rincón, B.; Borja, R.; Jeison, D. (2016). Screening of biomethane production potential from dominant microalgae. Journal of Environmental Science and Health, Part A 51(12), 1062–1067. DOI: 10.1080/10934529.2016.1198627 DOI
- Perendeci, N.; Yılmaz, V.; Ertit Taştan, B.; Gökgöl, S.; Fardinpoor, M.; Namlı, A.; Steyer, J. (2019). Correlations between biochemical composition and biogas production during anaerobic digestion of microalgae and cyanobacteria isolated from different sources of Turkey. Bioresource Technology 281, 209–216. DOI: 10.1016/j.biortech.2019.02.086 DOI
- He, S.; Fan, X.; Katukuri, N.R.; Yuan, X.; Wang, F.; Guo, R.B. (2016). Enhanced methane production from microalgal biomass by anaerobic bio-pretreatment. Bioresource Technology 204, 145–151. DOI: 10.1016/j.biortech.2015.12.073 DOI
- Jankowska, E.; Sahu, A.K.; Oleskowicz-Popiel, P. (2017). Biogas from microalgae: Review on microalgae's cultivation, harvesting and pretreatment for anaerobic digestion. Renewable and Sustainable Energy Reviews 75, 692–709. DOI: 10.1016/j.rser.2016.11.045 DOI
All sources of the site: bibliography.
Other substrates in the group “Algae and aquatic plants”
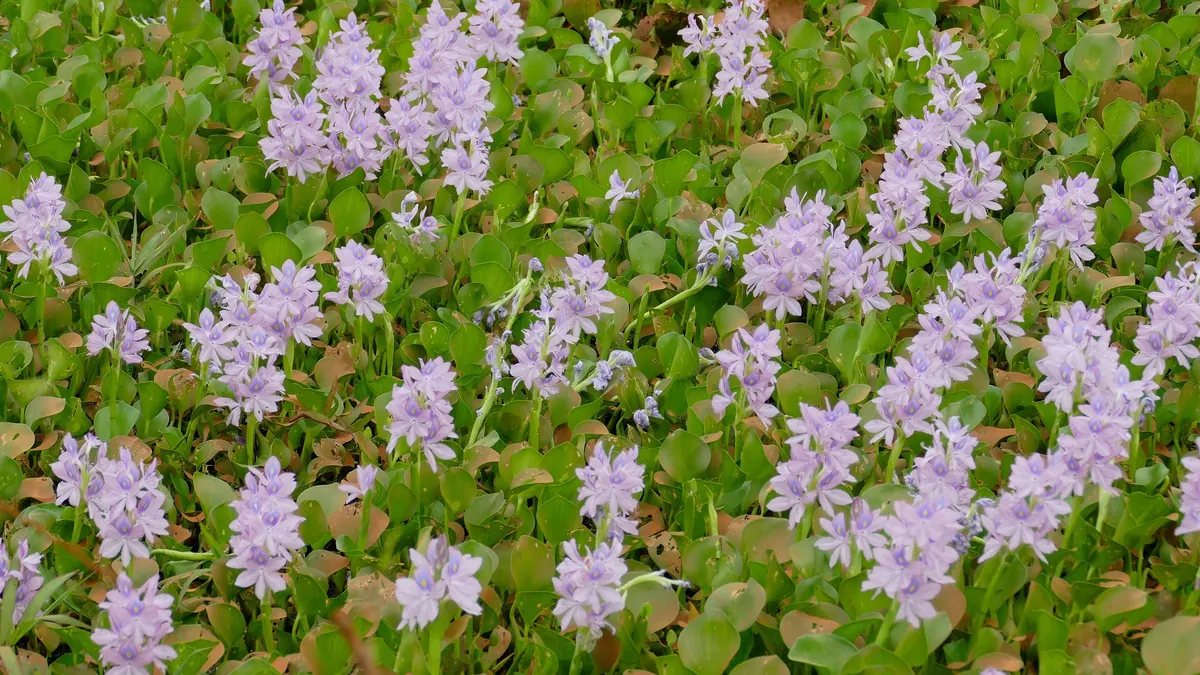
Water hyacinth — BMP: 3 studies, weighted mean 191 m³ CH₄/t VS
191 m³ CH₄/t VS weighted mean from 3 studies
≈52 %
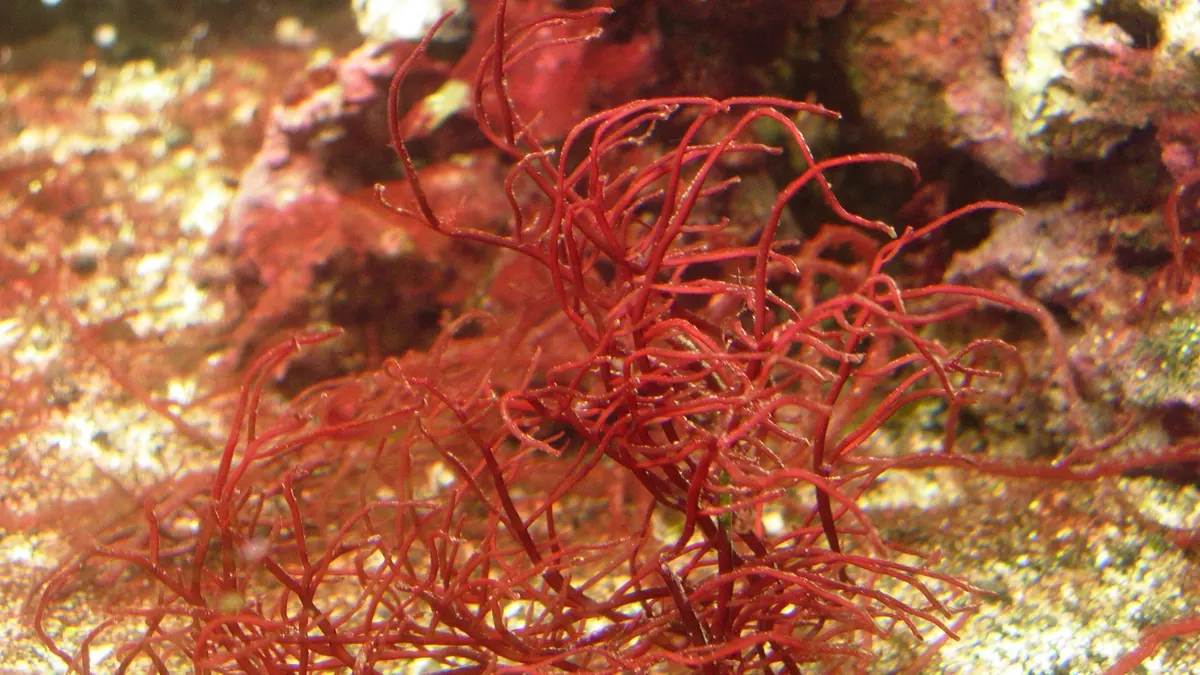
Red seaweeds (Gracilaria, Palmaria) — BMP: 2 studies, weighted mean 206 m³ CH₄/t VS
206 m³ CH₄/t VS weighted mean from 2 studies
≈52 %
Chlamydomonas reinhardtii — BMP: 2 studies, weighted mean 346 m³ CH₄/t VS
346 m³ CH₄/t VS weighted mean from 2 studies
≈58 %
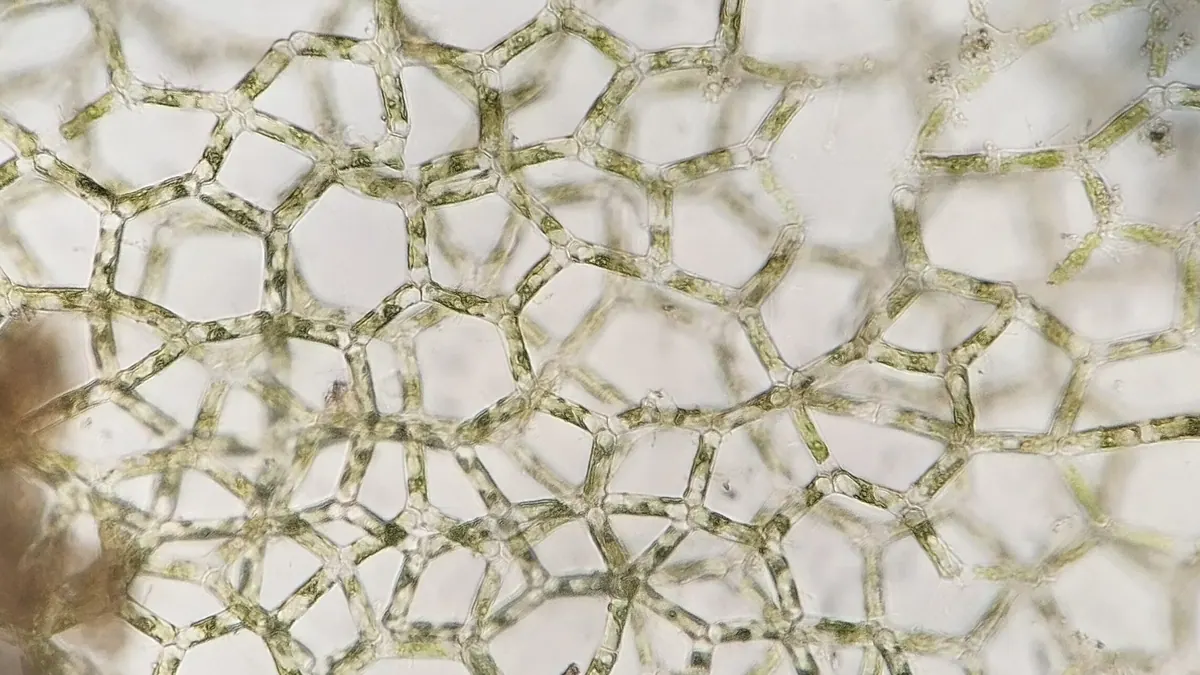
Hydrodictyon reticulatum (water net) — BMP: 2 studies, weighted mean 250 m³ CH₄/t VS
250 m³ CH₄/t VS weighted mean from 2 studies
≈52 %