


BMP testingBy-products of the agri-food industry
Glycerol refining residues (MONG, distillation residue) — BMP: 2 studies, weighted mean 406 m³ CH₄/t VS
MONG and distillation residues from glycerol purification are a waste of biodiesel production, containing glycerol, soaps, salts and fatty acids; results of several studies are almost consistent.
Illustration: FeedstockData (AI, Google Gemini)
- Weighted mean
- 406m³ CH₄/t VS
- Range
- 397–414m³ CH₄/t VS
- Records
- 2studies
- Publications
- 2sources
- Temperatures
- 38 °Cof the test
Methane in biogas
High methane content · ≈ 6.3 kWh/m³ of biogas
estimate from the substrate type The collected studies contain no measurement. The interval follows from the approximate composition (carbohydrate-dominated (no protein or fat characteristics); fat-rich (process classification)) and the yields of compound groups according to FNR.
Rating for biogas plants
not rated — editorial rating for biogas plants
Not rated: no dry matter or volatile solids in the data. We calculate the rating when the dry matter and volatile solids of the material are known.
Add to the co-digestion calculator CSV data
BMP curves from 2 studies
Weighted mean Individual records
Dashed lines are a model curve (first-order kinetics, B(t) = B₀·(1 − e−kt)); the end point comes from the publication. All curves are model curves.
Cumulative methane production over the test [m³ CH₄/t VS]. The thick line is the weighted mean of all records (406); dots mark the end values given in the publications. Point at the chart to read values; click a legend item to hide or show a record.
Records and sources
Download CSV| Source | BMP m³ CH₄/t VS | Temperature | Sample | Curve |
|---|---|---|---|---|
| Borowski i Cieciura-Włoch (2021) DOI | 397 | — | MONG (matter organic non glycerol from glycerol processing), no enzyme | end point (model curve) |
| Dubrovskis i Plume (2024) DOI | 414 | 38 °C · mesophilic | Glycerol distillation residue | end point (model curve) |
| Weighted mean | 406 | arithmetic mean 406, SD 12 | ||
Process properties
Advantages
- Methane potential in the Substraty.pl BMP dataset: weighted mean 405.5 m³ CH₄/t VS (SD 12.0; 2 records, 2 sources).
- Contains glycerol, which in co-digestion with slurry and sludge increased biogas production (Astals et al. 2012; Fountoulakis et al. 2010).
Drawbacks and risks
- Free LCFA, soaps and salts (Na, K, sulphates) inhibit the process (Chen et al. 2008).
- Composition variable - set the dose after analysis.
- Excess glycerol destabilises the process: in a sewage sludge digester severe disruption was observed above 1% (v/v) (Fountoulakis et al. 2010), and in agricultural systems above 8% by mass the co-digestion effect disappears and inhibition is possible (FNR 2010).
- Crude glycerol may contain more than 20% methanol, which at high concentrations inhibits methanogens (FNR 2010).
Co-digestion — what to combine it with, what to watch out for
- combines well
substrates: high alkalinity (buffer) — e.g. Cattle manure, Pig slurry, Cattle slurry, Duck slurry, Rumen and digestive tract content
- avoid
substrates: fat-rich — e.g. Food waste, Spent coffee grounds, Primary sludge, Sunflower seeds, Olive pomace / olive mill solid waste
Glycerine residues + fats/oils: LCFA accumulation.[3]
Dosing
Indicative limit from the literatureup to 6% fresh mass of the feed[4][1][2]
Basis: share of glycerine in the feed mixture (fresh matter) in co-digestion with slurry and agricultural biomass. FNR (2010): adding crude glycerol up to a max. of 6% by mass gives a clear synergy, while above 8% the co-digestion effect disappears and inhibition is possible; crude glycerol may be rich in methanol (over 20% by mass). Astals et al. (2012, 2013) obtained good results with pig slurry at 4% (mesophilic, wet mass) and 3% (thermophilic, mass) glycerol. For a wastewater treatment plant digester the limit is much lower: Fountoulakis et al. (2010) — up to 1% v/v in sewage sludge, above which the process is severely disrupted. Residues (MONG) may differ in composition from pure glycerol — treat 6% as an upper guide and start at 1–2%.
Introduce gradually, starting with a small dose and monitoring the process (e.g. FOS/TAC, pH, gas composition).
Sources of the process data
- Astals et al. (2012). Anaerobic co-digestion of pig manure and crude glycerol at mesophilic conditions. Bioresour. Technol.
- Astals et al. (2013). Thermophilic co-digestion of pig manure and crude glycerol: process performance and digestate quality. J. Biotechnol.
- Long et al. (2012). Anaerobic co-digestion of fat, oil, and grease (FOG): A review of gas production and process limitations. Process Saf. Environ. Prot.
- FNR (2010). Guía sobre el Biogás – Desde la producción hasta el uso (hiszp. wydanie „Leitfaden Biogas”, GIZ 2013)
- Fountoulakis, Petousi, Manios (2010). Co-digestion of sewage sludge with glycerol to boost biogas production. Waste Manag.
- Fountoulakis, Manios (2009). Enhanced methane and hydrogen production from MSW and agro-industrial by-products co-digested with crude glycerol. Bioresour. Technol.
- Chen, Cheng, Creamer (2008). Inhibition of anaerobic digestion process: A review. Bioresour. Technol.
The co-digestion calculator will assess a specific mixture containing this substrate.
What it is and where it comes from
Glycerol arises as a by-product of biodiesel (fatty acid methyl ester) production. Crude glycerol contains methanol, soaps, salts and residual fats, and in its purification by distillation fractions rich in organic components other than glycerol remain, called MONG, together with distillation residues. In Poland, a large biodiesel producer, such wastes arise at glycerol production plants and refineries.
Properties relevant to digestion
The residues are a mixture of fatty acids, soaps, esters, residual glycerol and inorganic salts (of sodium, potassium, sulphates or chlorides depending on the process). The organic part has a high energy potential, but free long-chain fatty acids can inhibit methanogenesis and cause foaming. A high salt content and the alkalinity of the residue are sometimes an additional risk. The material is dense and requires heating for pumping. The composition depends strongly on the glycerol purification technology and the biodiesel feedstock.
How to read the spread of results
The dataset contains several records from several sources: MONG from glycerol processing (no temperature given) and a residue from glycerol distillation (38 °C). The results are almost consistent, but these are different materials from different plants, and the common value may be coincidental. Influences include the purification technology, the salt and water content, the form of the sample, the adaptation of the inoculum to lipids and the substrate-to-inoculum ratio.
In biogas plant practice
Such residues are used in small, gradually increased shares, with strict monitoring of volatile acids, pH and salinity. Combining with slurry and stable dosing are recommended. The material must be tested for contaminants, for example methanol and metals. As a waste from the fuel industry it is subject to the waste rules, and use at a biogas plant requires compliance with the permits held and, where relevant, with the requirements of sustainability schemes for biogas.
Because the composition of such residues differs between plants, for stable operation each batch must be analysed for fatty acid, salt, pH and water content, and only then the dose determined. The literature result is merely a starting point.
From the energy balance perspective this is an attractive but risky material: its share is worth increasing in stages, observing volatile acids and biogas composition over at least several retention cycles.
Methodology in brief
BMP is the amount of methane obtained from volatile solids (VS) in a batch test, given in m³ CH₄ per tonne of VS (numerically the same as NmL CH₄/g VS in the publications) and converted to normal conditions (0 °C, 101.325 kPa). The weighted mean gives each publication a total weight of 1, split equally between its results for the substrate — a paper testing twenty varieties does not outweigh a paper with a single sample. In inter-laboratory programmes the unit is the laboratory (total weight 1), and within it the weight of a test grows with the number of bottles (replicates). Results after pretreatment (e.g. thermal, chemical, enzymatic) are shown separately and are not included in the mean.
Solid lines are curves measured in the tests. Where a publication gives only the final result, we draw a first-order kinetic model, B(t) = B₀·(1 − e−kt): only the end point comes from the publication, and the shape of the curve serves purely as visualisation — do not read the production on a particular day from it. For this substrate k = 0.091 d−1 was assumed (no kinetic data for the group – the median of all available rate constants k (93 values) was used).
The statistics describe the spread of published results — a descriptive compilation, not a meta-analysis or a guarantee of plant yield.
Bibliography
- Borowski, S.; Cieciura-Włoch, W. (2021). Enzymatic Pretreatment of Byproducts from Soapstock Splitting and Glycerol Processing for Improvement of Biogas Production. Molecules 26(22), 6782. DOI: 10.3390/molecules26226782 DOI
- Dubrovskis, V.; Plume, I. (2024). Biogas potential from biodiesel production residues. Engineering for Rural Development 23. DOI: 10.22616/erdev.2024.23.tf104 DOI
All sources of the site: bibliography.
Other substrates in the group “By-products of the agri-food industry”

Coconut meal / oil cake — BMP: 3 studies, weighted mean 296 m³ CH₄/t VS
296 m³ CH₄/t VS weighted mean from 3 studies
≈66 %
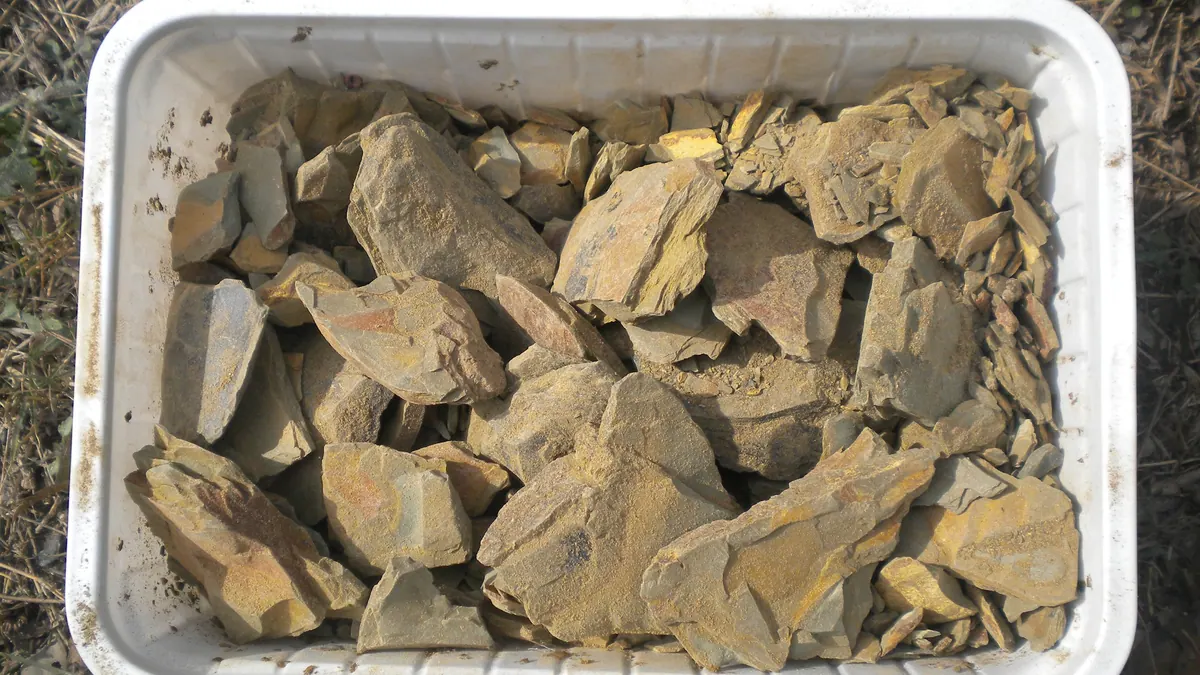
Oil refining residues (gums, condensates, spent earth) — BMP: 5 studies, weighted mean 714 m³ CH₄/t VS
714 m³ CH₄/t VS weighted mean from 5 studies
≈63 %
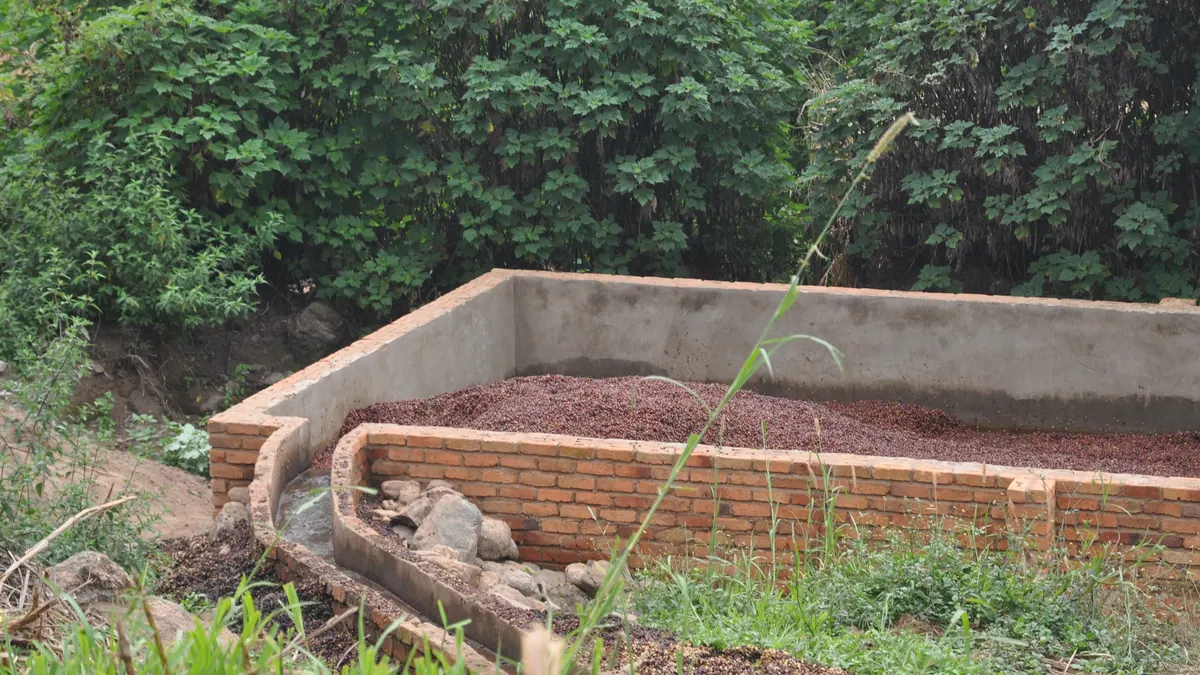
Coffee pulp — BMP: 3 studies, weighted mean 225 m³ CH₄/t VS
225 m³ CH₄/t VS weighted mean from 3 studies
≈52 %
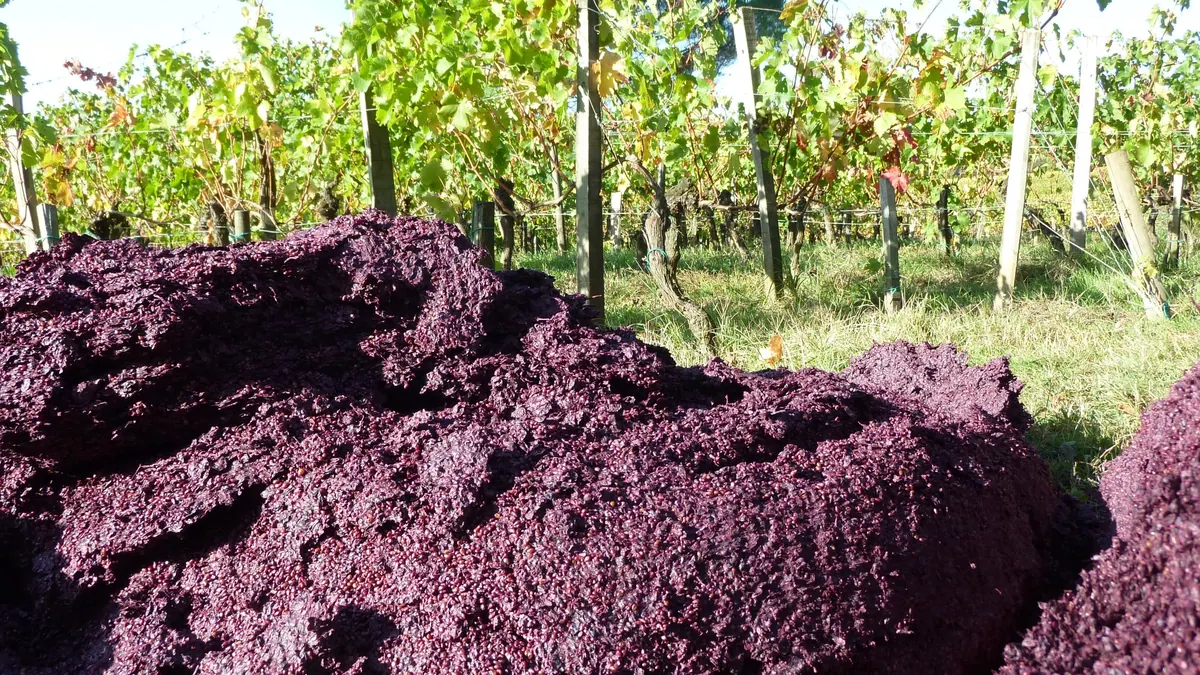
Grape pomace (marc) — BMP: 6 studies, weighted mean 221 m³ CH₄/t VS
221 m³ CH₄/t VS weighted mean from 6 studies
≈54 %