


Pig manure (solid) — BMP: 5 studies, weighted mean 293 m³ CH₄/t VS
293 m³ CH₄/t VS weighted mean from 5 studies
good — editorial rating for biogas plants≈54 %
BMP (biochemical methane potential) is the amount of methane that can be obtained from a unit of organic mass of a substrate in a batch test. We compile the results of many publications for each substrate, calculate a weighted mean and show all the curves at once.
RSS293 m³ CH₄/t VS weighted mean from 5 studies
good — editorial rating for biogas plants≈54 %
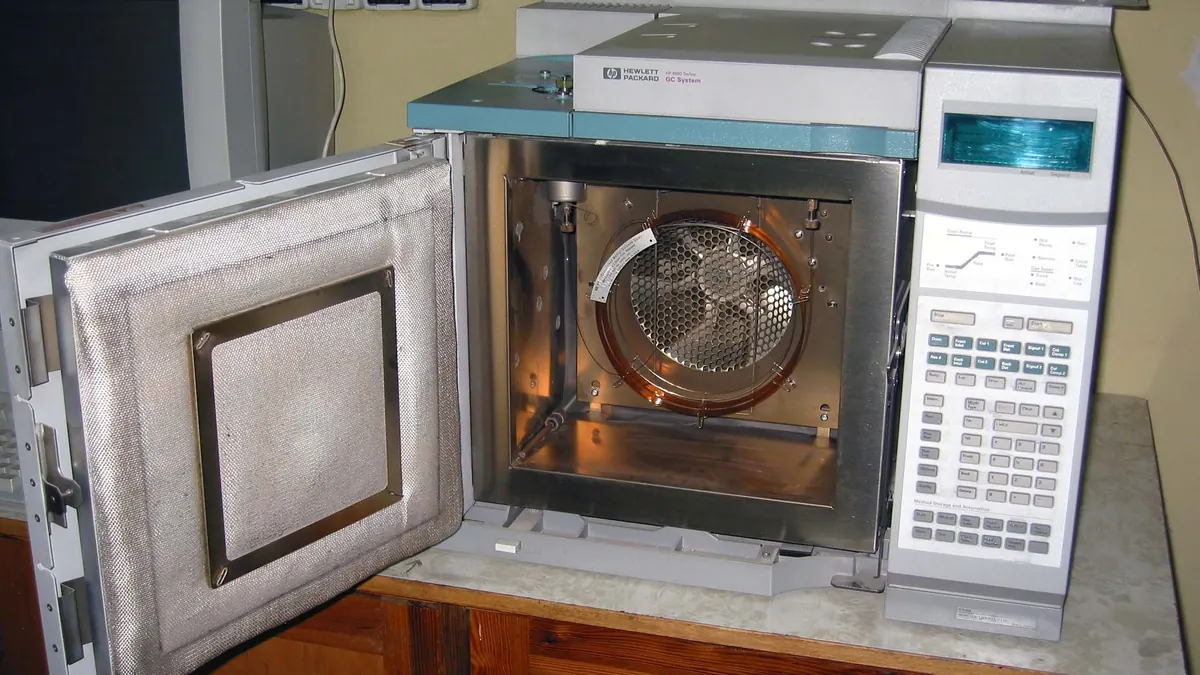
Two documents often cited in fermentation test reports: the German guideline VDI 4630 and the standard ISO 11734. We explain their scope and why they are not interchangeable.

241 m³ CH₄/t VS weighted mean from 2 studies
good — editorial rating for biogas plants≈53 %

296 m³ CH₄/t VS weighted mean from 2 studies
≈52 %

280 m³ CH₄/t VS weighted mean from 2 studies
≈52 %
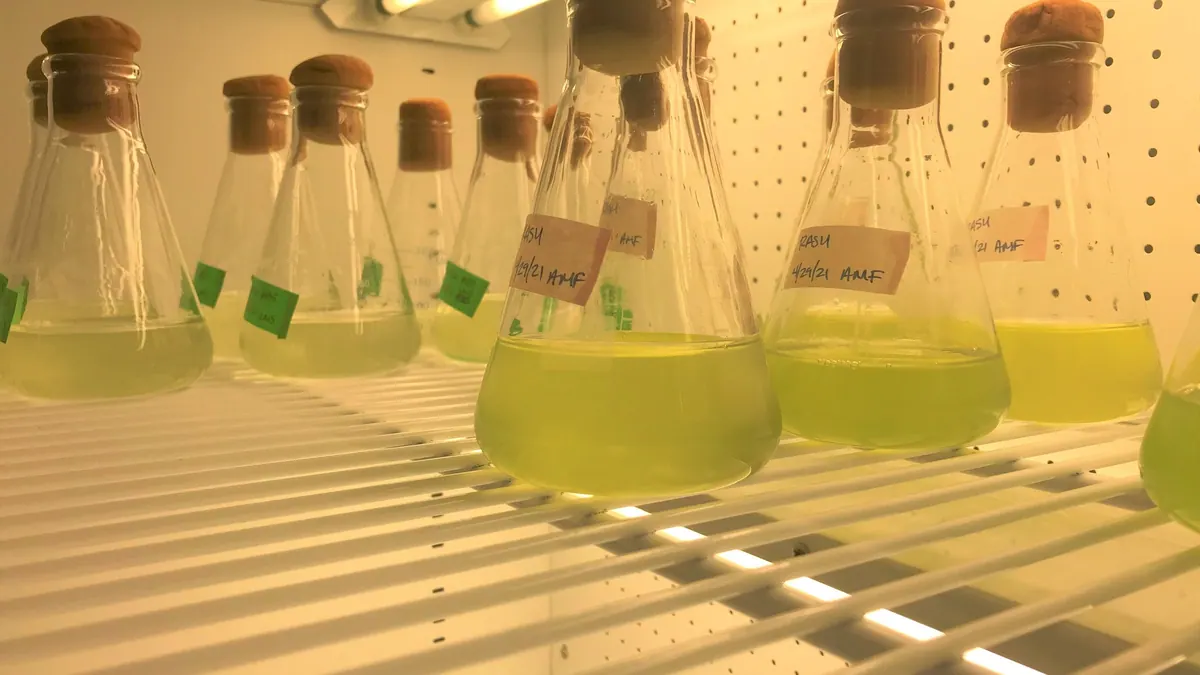
How to calculate the maximum yield of CH₄ and CO₂ from a molecular formula or elemental composition. Three numerical examples, the limitations of the method and comparison with the BMP result.

431 m³ CH₄/t VS weighted mean from 2 studies
≈63 %

Why does the same silage give different BMP in different laboratories? A review of the sources of scatter, measures (SD, RSD, z-score), an example and rules for comparing results.
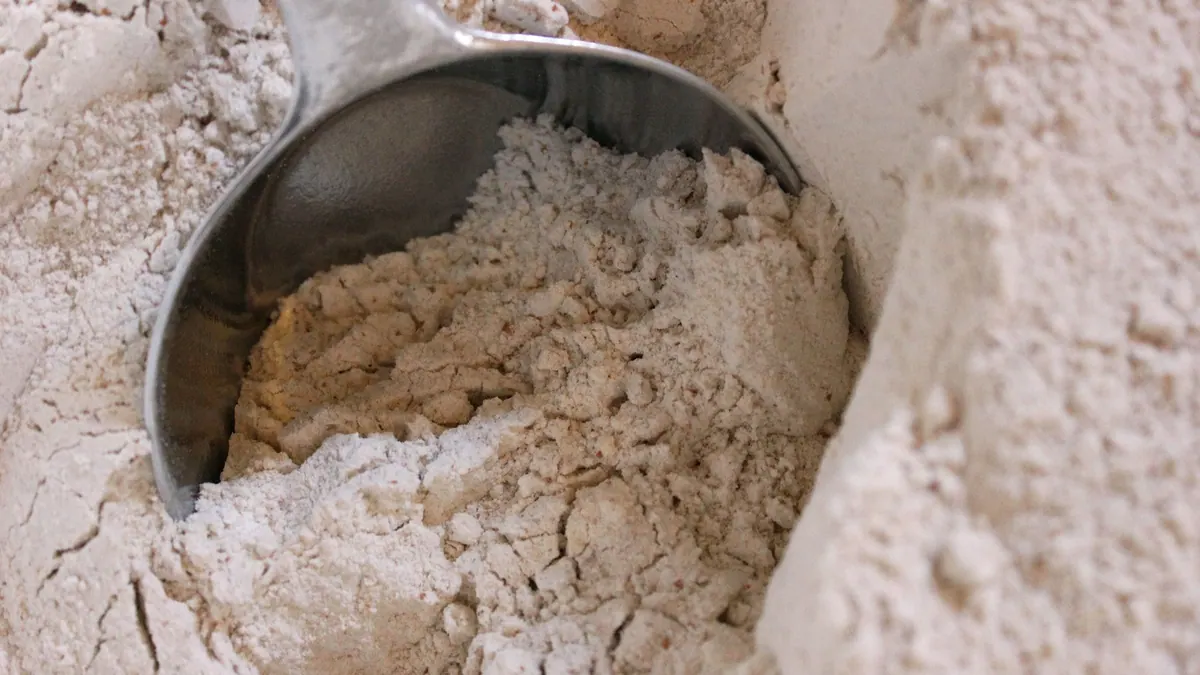
350 m³ CH₄/t VS weighted mean from 4 studies
very good — editorial rating for biogas plants≈52 %

When a BMP curve has a lag phase and a sigmoidal shape, the modified Gompertz model is used. We explain the parameters P, Rm and λ, and show a calculation and the pitfalls.

344 m³ CH₄/t VS weighted mean from 2 studies
≈52 %
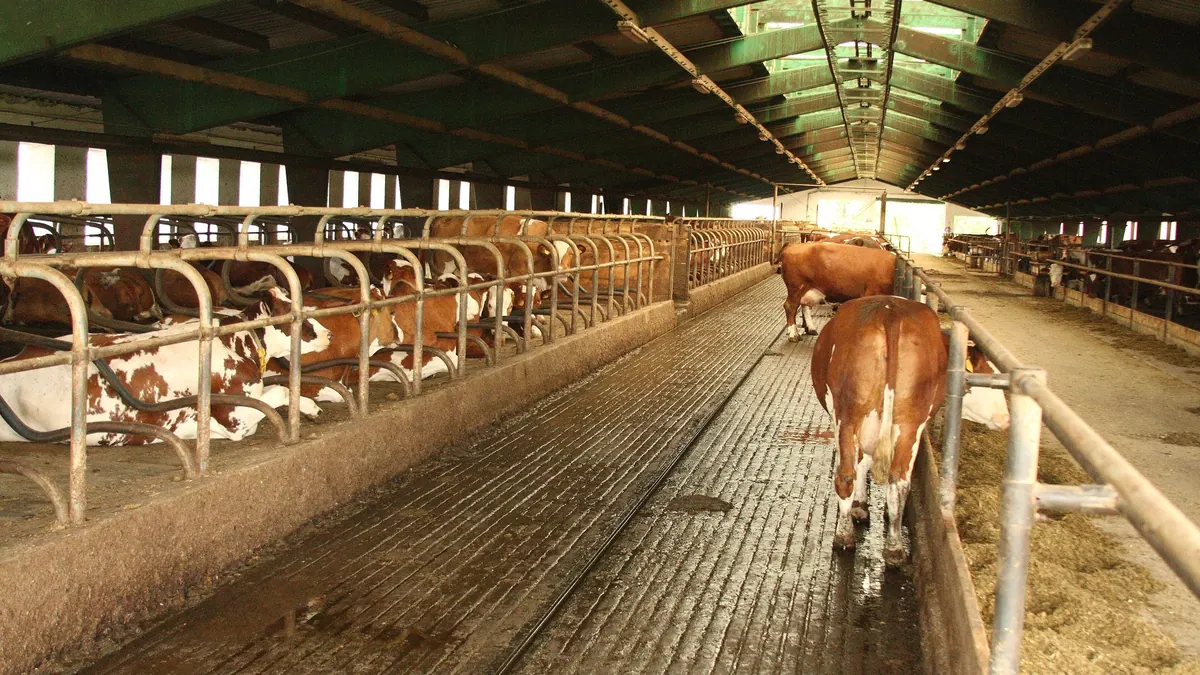
236 m³ CH₄/t VS weighted mean from 14 studies
very good — editorial rating for biogas plants≈54 %
324 m³ CH₄/t VS weighted mean from 10 studies
good — editorial rating for biogas plants≈53 %

323 m³ CH₄/t VS weighted mean from 8 studies
good — editorial rating for biogas plants≈52 %

99 m³ CH₄/t VS weighted mean from 3 studies
neutral — editorial rating for biogas plants≈52 %
How can a BMP curve be described with a single equation? The first-order model gives B₀, the rate constant k and the t90 time. We show the fitting, an example and the limitations of the model.
289 m³ CH₄/t VS weighted mean from 5 studies
good — editorial rating for biogas plants≈53 %

200 m³ CH₄/t VS weighted mean from 6 studies
58 %

154 m³ CH₄/t VS weighted mean from 11 studies
≈52 %

270 m³ CH₄/t VS weighted mean from 2 studies
good — editorial rating for biogas plants≈52 %

345 m³ CH₄/t VS weighted mean from 145 studies
good — editorial rating for biogas plants≈53 %

261 m³ CH₄/t VS weighted mean from 4 studies
≈55 %

119 m³ CH₄/t VS weighted mean from 8 studies
neutral — editorial rating for biogas plants≈52 %
Why does laboratory BMP usually exceed the actual yield of a plant? We break the difference down into factors: time, kinetics, losses, data errors and measurements. With a worked example.